The Mount Rushmore of the Texas Rangers

Josh Hamilton crushes a homer against the Orioles a few weeks ago / Joy R. Absalon-US PRESSWIRE

Let’s take a look at the Texas Rangers, including their years as the second version of the Washington Senators.

When the Senators came into the league in 1961, they were pretty bad. In their first four seasons, they lost at least 100 games every season. They didn’t finish higher than 6th until their 9th season in 1969, and that’s only because the leagues were split into divisions. From 1972 to 1993, the relocated Rangers finished 2nd six times and were in first when the season was aborted in 1994.

The Rangers finally made the playoffs for the first time in 1996 and had a nice run of 3 post-season appearances in 4 seasons, but won only 1 game over all the series. They didn’t make the playoffs again until 2010, when they made the World Series, a feat they duplicated last year. The franchise is at its peak right now.
Continue reading


Catching up on Monday’s games

@Athletics 10, Rangers 1: Oakland cruised after an 8-run 2nd — 3 more than their previous high inning — while rookie Jarrod Parker held the Rangers hitless through 7 IP before Michael Young‘s clean single up the middle.

  • Through 9 career starts, Parker has allowed 13 runs in 54.1 IP for a 2.15 ERA. Six runs came in one start; in the other 8, he went 5+ IP on 2 runs or less. Crank up the Play Index … Parker tied Dave “Boo” Ferriss for the most such starts (since 1918) within the first 9 career games. And his 6 starts of 5+ IP and 1 run or less also ties the known record, shared by Zach Britton and Andy Rincon. (Always bear in mind that breaking in as a starter is a relatively recent phenomenon; even someone as proven as Lefty Grove relieved in 60% of his rookie games.)
  • Continue reading

Derek Jeter and the five teams that passed on him in 1992

With the First-Year Player Draft going on as we speak in baseball, I read an interesting tweet from Jay Jaffe a little while ago. Jay tweeted:

It got me interested, and it turns out Jeter fell to the Yankees with the sixth pick in 1992. The Astros deserve some slack. The teams that drafted second through fifth picked far worse than they did.

Continue reading

The year that Tony Gwynn hit .400

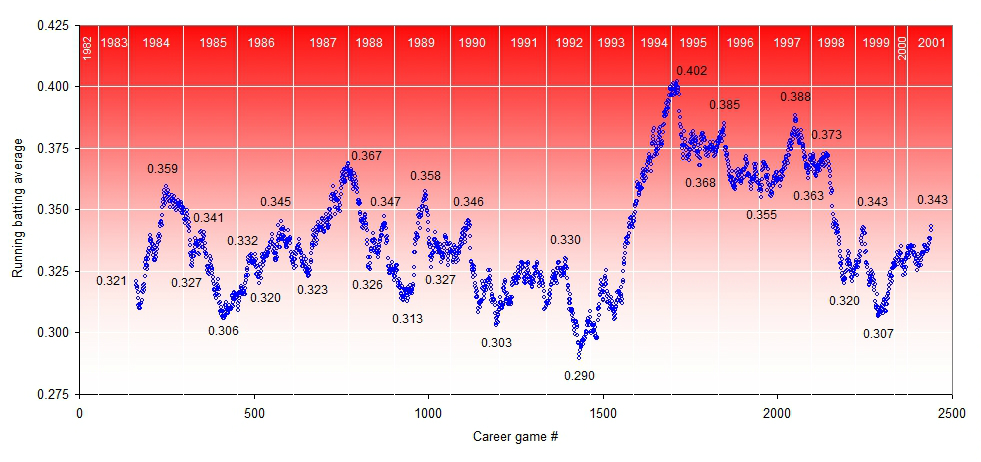
Here’s a treat for you. Following is a graph of Tony Gwynn‘s rolling batting average throughout his career for each 162-game period. The first data point is at his 162nd-career game and gives his batting average for his first 162 games.

Click on the image for a slightly larger version.

I’ve labeled many of the high and low points. Right away, you’ll notice that Gwynn hit .402 over a 162-game period ending in 1995. From July 27th 1993 through May 13, 1995, Gwynn appeared in 162 games, and had 704 plate appearances. He had 624 at-bats with 251 hits (.402 BA), as well as 15 HR, 100 RBI, 121 runs scored, a .457 OBP and a .563 SLG.

Other notes about the fabulous Mr. Gwynn:

  • It’s hard not to think of Ted Williams‘ 1941 at this point. That year, Williams batted .406 while leading the league with 37 HR, a .553 OBP, a .735 SLG, and a 235 OPS+. Gwynn was obviously not the same kind of hitter as Williams, never showing that same kind of power. Still over the 1994 season (all of which was encompassed in his .400 season) Gwynn had an OPS+ of 169, his career high. Gwynn also gets high marks for maintaining his average over 624 at-bats. In Williams’ season, he had only 456 at-bats thanks mainly to his very high walk total (and the fact that he didn’t play 162 games.)
  • The lowest “rolling-162” batting average of Gwynn’s career was .290 (actually .28952), which he had after the game on August 1, 1992. His full stat line for the preceding 162, covering back to June 23, 1991, was 702 PAs, 639 at-bats, 8 HR, 51 RBI, 88 runs scored, with a slash line of .290/.348/.388. Decidedly un-Gwynnish, but a “worst” career line that hundreds of ballplayers would gladly take, especially the .348 OBP.
  • Dude closed out his career batting .343 in his final 162 games, slightly higher than his career mark of .338.
  • Those 251 hits Gwynn got over his .400 “season”–that’s an extremely high number. Ichiro had 262 in 2004 (with the benefit of 704 at-bats) and before that the last guy to have so many in a regular season (within a single year) was Bill Terry, with 254 in 1930.


Saturday selections

A few notes on Saturday’s games.

Orioles 2, @Rays 1: For the first time since last Saturday, the O’s managed to ferry a lead to their lights-out bullpen. Pedro Strop frayed some nerves after inheriting 2 men on with 1 out in the 8th, moving them up with a wild pitch and loading the bases with a walk. But Ben Zobrist hit the first pitch for a GIDP, and Jim Johnson pitched a perfect 9th to snap Balto’s 6-game slide and notch his MLB-high 17th save.

Putting the ball in play – Anti-TTO specialists

HHS reader Paul E recently identified that Adam Dunn is on pace to obliterate the record for the highest season total of strikeouts and walks, believed to be Mark McGwire‘s 317 (162 BB, 155 SO) in 1998, one of only a handful of seasons above 300. Dunn, though, is currently on pace for 133 BB and 260 SO, perilously close to the 400 mark.

Strikeouts and walks are two of the TTOs (three true outcomes – HRs are the third), so named because a batter’s PA does NOT result in a batted ball being put into play (at least not so that the defense can do anything about it). McGwire’s total in 1998 for all of the TTOs was 387, a mark that Dunn, barring injury, is certainly likely to challenge, if not surpass.

But, what about the opposite end of the spectrum – which hitters have accumulated the lowest TTO totals? I’ll take a look after the jump.

Continue reading

The Mets have had more than their share of complete game 1-hitters

Some quick math, 1962-present

Mets: 26 complete-game 1-hitters

All other teams: 467 complete-game 1-hitters

Mets: 8,020 total games

All other teams: 201,898

So all other teams have produced 467 1-hitters in 201,898 games, or a rate of 0.23% of the time.

The Mets have produced 26 1-hitters in 8,020 games, or a rate of 0.32% of the time.

It may not sound like a lot, but it means that the Mets should have had 18 or 19 1-hitters in their existence instead of the 26 they’ve actually had. What does this tell us? What we already knew–they had been overdue for a no-hitter.

In other Friday games…

A variously detailed look at a selection of non-no-hitters….

@White Sox 7, Mariners 4: You win this kind of game when you’re on a streak. Jake Peavy cruised into the 7th with a 4-0 lead (1 hit, 2 walks), but it slipped away over the next 2 innings, mainly on big hits by Kyle Seager (who’s hitting lefties as well as righties). Chi fans needn’t have fretted: M’s CF Michael Saunders (who made a great catch in the 7th to start a DP) took an embarrassing facial to start the 8th, and Chicago scored 3 unearned runs after 2 were out.