In the final installment of WAR leaders by position since 1961, we look at pitchers and catchers. As with the earlier posts, the methodology is to identify the leader in cumulative bWAR over 5-year periods for players appearing in a designated position for at least 75% of their games. For pitchers, this means that a pitcher must appear in either a starting or relieving role for 75% of their games to be included on the leader board.
Monthly Archives: March 2012
Site issues – UPDATED
We appear to be having some site issues with intermittent slow loading and/or downtime. I am investigating.
UPDATE: I have made some modifications to the site, specifically adding a cache plugin. This should ultimately speed up your loading time of the blog and also reduce our overall bandwidth use. The popularity of the blog has gotten so high that it was starting to use too much bandwidth and my ISP was restricting access!
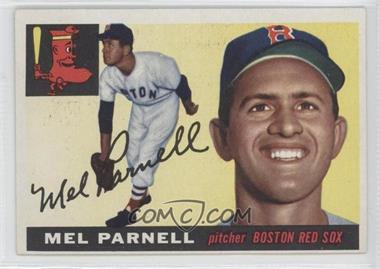
Mel Parnell 1922-2012
Mel Parnell passed away a few days ago at the age of 89. Parnell was a mainstay in the Red Sox rotation in the late 40s and early 50s. During his 10-year career from 1947 to 1956, all with Boston, the Red Sox compiled a .554 winning percentage. When Parnell started, that shot up to a .647 clip.
Parnell was among the top major league pitchers during his career, placing 8th in ERA+, 10th in WAR and W-L %, and 3rd in lowest HR/9 for the 1947 to 1956 period.
Stat Challenge scoring and projections
Every fantasy league has different rules, and here’s how FanDuel.com scores it for hitters:
1B = 1pt
2B = 2pts
3B = 3pts
HR = 4pts
RBI = 1pt
R = 1pt
BB = 1pt
SB = 2pts
HBP = 1pt
Out (calculated as at bats - hits) = -.25pt
Since each contest on FanDuel is just 1 game, all we really care about is what each player on your chosen team does on game day. You’ll be required to draft 1 player at each position, so let’s break down 2011 by position to see how each player would rate on a per-game basis. Continue reading
For slash line, at least, Chipper Jones ranks tops for third basemen
A couple of years ago, I wrote a column for my website asking if Chipper Jones was a future Hall of Famer. With news this morning that the Atlanta Braves third baseman will be retiring at the end of the 2012 season, I’m reminded of the flood of responses that came in after my post. Among the things I learned: Jones has been phenomenal for posting a .300 batting average, .400 on-base percentage, and .500 slugging percentage.
Besides a career slash line that currently sits at .304/.402/.533, Jones also has the most seasons by a third baseman of topping .300/.400/.500. In fact, it’s not even close. Of the 29 third basemen who’ve hit those numbers in a season with a minimum 500 plate appearances, just eight of these men have done it twice. Jones has done it six times.
All-time Wins leaders by team among single-franchise pitchers
Here are the franchise leaders for most wins by pitchers who pitched for only that franchise. Eat your heart out, Mets fans.
Seven Strikeouts: The New Normal
It has been widely noted that some of the trends associated with the immediate post-baseball-strike period (1995 through the early years of the 21st century) have abated over the last few seasons. Home runs and run scoring are both down from their peak, as are walks and hits.
Average home runs per team per game 2000: 1.17
Average home runs per team per game 2011: 0.94
Average runs per team per game 2000: 5.14
Average runs per team per game 2011: 4.28
Average hits per team per game 2000: 9.31
Average hits per team per game 2011: 8.70
Average walks per team per game 2000: 3.75
Average walks per team per game 2011: 3.09
But one stat that was also historically high in the heavy run-scoring period that peaked around 10 years ago has continued to climb ever higher. That’s strikeouts. More details after the jump. Continue reading
Pythagorean Estimated Wins for SPs (1893-2011)
[Another work-in-progress. Your observations are welcomed, but please review the “Known shortcomings” at the end of the post.]
Taking suggestions from readers Mike L. and kds, I used the Pythagorean method to calculate the estimated career wins for all starting pitchers with at least 1,000 innings from 1893-2011 (min. 60% of career games as a SP).
Get ready for our Stat Challenge!
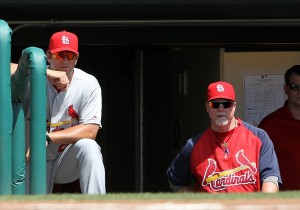
Mike Matheny and a very grey Mark McGwire want you to sign up with FanDuel.com so you can participate in High Heat Stats’ Stat Challenge!
5 Year WAR Leaders – Outfielders 1961-2011
In the second installment of 5-year WAR leaders since 1961, this post looks at players in outfield and DH positions. The methodology is to determine bWAR leaders for each year based on cumulative 5-year bWAR ending in that year. To qualify for the leader board, players must play 75% of their games in the period at the indicated position.


