
This post is for voting and discussion in the 129th round of balloting for the Circle of Greats (COG). This is the first of four rounds of balloting adding to the list of candidates eligible to receive your votes those players born in 1974. Rules and lists are after the jump.
The new group of 1974-born players, in order to join the eligible list, must, as usual, have played at least 10 seasons in the major leagues or generated at least 20 Wins Above Replacement (“WAR”, as calculated by baseball-reference.com, and for this purpose meaning 20 total WAR for everyday players and 20 pitching WAR for pitchers). This first group of 1974-born candidates, including those with A-C surnames, joins the eligible holdovers from previous rounds to comprise the full list of players eligible to appear on your ballots.
In addition to voting for COG election among players on the main ballot, there will be also be voting for elevation to the main ballot among players on the secondary ballot. For both ballots, which may be voted at the same time or in separate posts, voters must include three and only three eligible players. For the main ballot election, the one player who appears on the most ballots cast in the round is inducted into the Circle of Greats, while for the secondary ballot election, the one player appearing on the most ballots cast is elevated to the main ballot for the next COG election round. In the case of ties, a runoff election round will be held for COG election, while a tie-breaking process will be followed to determine the secondary ballot winner.
Players who fail to win either ballot but appear on half or more of the ballots that are cast win four added future rounds of ballot eligibility. Players who appear on 25% or more of the ballots cast, but less than 50%, earn two added future rounds of ballot eligibility. One additional round of eligibility is earned by any player who appears on at least 10% of the ballots cast or, for the main ballot only, any player finishing in the top 9 (including ties) in ballot appearances. Holdover candidates on the main ballot who exhaust their eligibility will drop to the secondary ballot for the next COG election round, as will first time main ballot candidates who attract one or more votes but do not earn additional main ballot eligibility. Secondary ballot candidates who exhaust their eligibility will drop from that ballot, but will become eligible for possible reinstatement in a future Redemption round election.
All voting for this round closes at 11:59 PM EST Thursday, January 31st, while changes to previously cast ballots are allowed until 11:59 PM EST Tuesday, January 29th.
If you’d like to follow the vote tally, and/or check to make sure I’ve recorded your vote correctly, you can see my ballot-counting spreadsheet for this round here: COG 1974 Part 1 Vote Tally. I’ll be updating the spreadsheet periodically with the latest votes. Initially, there is a row in the spreadsheet for every voter who has cast a ballot in any of the past rounds, but new voters are entirely welcome — new voters will be added to the spreadsheet as their ballots are submitted. Also initially, there is a column for each of the holdover candidates; additional player columns from the new born-in-1974 group will be added to the spreadsheet as votes are cast for them.
Choose your three players from the lists below of eligible players. The current holdovers are listed in order of the number of future rounds (including this one) through which they are assured eligibility, and alphabetically when the future eligibility number is the same. The 1974 birth-year players are listed below in order of the number of seasons each played in the majors, and alphabetically among players with the same number of seasons played.
Holdovers:
| MAIN BALLOT | ELIGIBILITY | SECONDARY BALLOT | ELIGIBILITY |
|---|---|---|---|
| Kevin Brown | 11 rounds | Andre Dawson | 10 rounds |
| Luis Tiant | 8 rounds | Ted Lyons | 4 rounds |
| Dick Allen | 5 rounds | Rick Reuschel | 4 rounds |
| Bill Dahlen | 5 rounds | Willie Randoph | 3 rounds |
| Manny Ramirez | 5 rounds | Todd Helton | 3 rounds |
| Graig Nettles | 3 rounds | Andy Pettitte | this round ONLY |
| Bobby Wallace | 3 rounds | ||
| Richie Ashburn | 2 rounds | ||
| Dwight Evans | 2 rounds | ||
| Ken Boyer | this round ONLY | ||
| Ted Simmons | this round ONLY | ||
| Don Sutton | this round ONLY |
Everyday Players (born in 1974, ten or more seasons played in the major leagues or at least 20 WAR, A-C surname):
Bobby Abreu
Miguel Cairo
Orlando Cabrera
Frank Catalanotto
Jamey Carroll
Marlon Anderson
Sean Casey
Jose Cruz
Roger Cedeno
Mark Bellhorn
Emil Brown
Pitchers (born in 1974, ten or more seasons played in the major leagues or at least 20 WAR, A-C surname):
Chad Bradford
As is our custom with first time candidates, here is a factoid and related quiz question on each of the new players on the ballot.
- Bobby Abreu recorded thirteen straight seasons (1998-2010) playing 150 or more games, tied with Willie Mays (1954-66) for the longest such streak in majors history. Excepting strike-shortened campaigns, which three players have longer streaks of such seasons? (Pete Rose, Cal Ripken, Rafael Palmeiro)
- Miguel Cairo played in 29 post-season games, but never in the World Series. Which player has appeared in the most post-season games without playing in the World Series? (Russell Martin)
- Orlando Cabrera is one of
threefive players with 600 games at shortstop in each league. Who are the othertwofour? (Monte Cross, George Davis, Leo Cardenas, Royce Clayton) - Frank Catalanotto topped 100 OPS+ and 15 oWAR for his career. Among such players with careers starting in 1995 or later, which retired outfielder hit fewer home runs than Catalanotto’s total of 84? (Angel Pagan)
- Jamey Carroll played over 250 games at 2B, SS and 3B. Who was the first expansion era player with such a career? (Tony Phillips)
- Chad Bradford recorded a 0.39 ERA for his post-season career. Who is the only pitcher with a lower career ERA in 20+ post-season games? (John Rocker)
- Marlon Anderson’s 7 home runs for the Dodgers are tied for the most by any player with fewer than 50 games for LA. Who was the first player with this achievement? (Steve Bilko)
- Jose Cruz’s .198 career ISO is fifth highest in a 5000 PA career with OPS+ under 105. Which player with OPS+ under 105 as a Blue Jay has the only ISO higher than Cruz’s in 2500 PA in Toronto? (Joe Carter)
- Sean Casey’s 197 hits in 1999 are the most by a Reds first baseman in the post-war era. Which post-war era Reds first baseman recorded a season leading the NL in hits? (Ted Kluszewski, 1955)
- Roger Cedeno’s age 24 season for the 1999 Mets featured a .300 BA, 60 steals and 60 walks. Which other NL player posted these totals at as young an age and, like Cedeno, did not lead his league in steals? (John McGraw, 1894-95)
- Mark Bellhorn‘s best season came in 2002 for the Cubs with 27 HR and an .886 OPS, but only 56 RBI. Who is the only Cub to post a higher OPS and fewer RBI in a 400 PA season? (Topsy Hartsel, 1901)
- Emil Brown logged 600 PA and stroked 150 hits in consecutive seasons (2005-06) aged 30-31, the oldest player to do so in his first two years in Kansas City. Who is the youngest player to post these totals in his first two seasons as a Royal? (Amos Otis)
8. This is definitely HHS favorite Joe Carter.
The answer to the first question must be Rose and Ripken.
Not sure why I wrote two, but there are actually three players, those two and one more.
Lower the threshold to 146 games and Ichiro joins them at 13 seasons. I haven’t the foggiest who the third player would be.
Lou Gehrig makes 13 seasons at 149 games, dipping that one game below 150 just once.
Rafael Palmeiro?
That’s it.
Is #4 Denard Span, or are we assuming he gets a job this summer?
Not Span, who hasn’t retired (yet).
9. Definitely Ted Kluszewski, 1955.
For several years I’ve been posting a table of certain stats for all the CoG candidates I regard as viable. The key figures include:
Total WAR
Peak 5-yr WAR
Best 5 yrs for WAR
WAR/G or WAR/9IP
WAR/yr (with certain minimal criteria for a season to count)
OPS+/ERA+
Career length, with the shortest career among the candidates (hitters & pitchers separate) the reference point at 1.0.
I don’t know if anyone pays the least attention to these tables. Obviously, they present an incomplete picture because they are so reliant on WAR, an imperfect measure. But I’m posting them again, mostly as a celebratoy affirmation of obsessive personality disorder.
This round, the only new, 1974-birthdate candidate I see as viable for the list is Bobby Abreu. The rest are holdovers.
Main Ballot Candidates
Pitchers
P(Tot)WAR…Peak5..Top5…WAR/9IP…WAR/Yr….ERA+…Career length
68.5 (68.3)……37.0…37.0……0.189……4.0 (17)……127……1.0………K. Brown
66.1 (66.7)……28.7…34.7……0.171……3.9 (17)……114……1.2………Tiant
68.7 (67.4)……22.5…27.3……0.117……3.0 (23)……108……1.6………Sutton
Position Players
WAR……Pk5……Top5……WAR/G…WAR/Yr……OPS+…Career length
60.0………29.7……31.1……0.025……3.8 (16)…..128………1.4……….Abreu
58.7………31.5……36.7……0.034……4.2 (14)……156………1.0………Allen
63.6………31.6……32.7……0.029……4.2 (15)……111………1.3………Ashburn
62.8………33.0……34.0……0.031……4.5 (14)……116………1.2………Boyer
75.2………22.6……29.8……0.031……4.0 (19)……110………1.4………Dahlen
66.9………23.7……28.3……0.026……3.5 (19)……127………1.4………Evans
68.0………28.7……32.2……0.025……3.4 (20)……110………1.4………Nettles
69.2………28.7……29.9……0.030……4.1 (17)……154………1.3………Ramirez
50.1………23.3……26.4……0.024……2.6 (19)……118………1.4………Simmons
70.2………28.6……31.3……0.029……4.2 (17)……105………1.3………Wallace*
* Wallace’s total WAR (incl. pitching) is 76.3.
WAR/Yr. includes only those seasons with 10 GS or 100 IP for starters, 20G for relievers, and 50G for position players.
Career length: 1.0 = K. Brown 3256.1 IP / Allen 7315 PA.
Secondary Ballot Candidates
Pitchers
P(Tot)WAR…Peak5..Top5…WAR/9IP…WAR/Yr….ERA+…Career length
67.2 (71.6)……24.2…29.0……0.145……3.6 (19)……118……1.6……….Lyons
60.9 (60.8)……20.3…28.4……0.166……3.4 (18)……117……1.0……….Pettitte
68.2 (70.1)……31.0…32.8……0.173……4.0 (17)……114……1.4……….Reuschel
Position Players
WAR……….Pk5……Top5……WAR/G…WAR/Yr……OPS+…Career length
64.4………32.4……33.7……0.025……3.4 (19)……119………1.5………..Dawson
61.4………37.4……37.4……0.027……3.8 (16)……133………1.3………..Helton
65.5………27.2……29.5……0.030……3.7 (18)……104………1.3………..Randolph
If you ranked the main ballot position players, 1-10, for each category and added them up, F W I W, it would look like:
27 Allen
28 Boyer
31 Ashburn
32 Manny
37 Nettles
37 Abreu
38 Wallace
42 Evans
55 Simmons
Whether or not this is relevant from a “logic” standpoint is anybody’s guess. If you asked me (and no one is asking), I’d go with oWAR and/or rBAT as some sort of tie-breaker in any discussion on the merits of any of these players. But, again, no one asked
An awfully odd approach, Paul. By the way, Dahlen would be at 36, but I have no idea what that means.
I think rBAT or oWAR make sense for outfielders and first basemen, whose defensive contributions lie in a narrow range, and who are expected to produce most of their value at bat. For the keystone infielders and catchers, I don’t think they are a fair measure, since they are expected to produce much more value in the field. Third basemen, it seems to me, vary by era on that score. In theory, oWAR and dWAR are on the same scale; the difference is the reliability of the stats, but that doesn’t mean dWAR is worth less than oWAR. Shaky defensive stats are as likely to undervalue as overvalue a fielder’s contributions.
My vote.
Main: Tiant, Evans, Wallace
Secondary: Dawson, Reuschel, Randolph
Dept. of Shameless Self-Promotion
Last spring, I wrote a series of posts for HHS devoted to baseball in the 1890s, which I regard as the point where the sport exits its early phase and enters its “modern” one (for reasons I explain ad nauseum in the posts). One of my goals in writing those posts was to create some interest in the era during which two of our CoG candidates played significant portions of their careers: Bill Dahlen and Bobby Wallace. My thinking was that those two players, who are the WAR leaders among current candidates, lose support because, although they fully qualify for the CoG under the birtlecom rules — both earned the requisite amount of WAR after 1900 — their 1890s performances are discounted as not relevant to baseball-as-we-know-it.
I think the top players of the 1890s — especially the ones that continued playing through the transition to the two-league structure of the 20th century — created baseball-as-we-know-it, and deserve, if anything, more, not less, credit for the roles they played when they played them. Although my posts deal with the era of the 1890s generally (and especially changes associated with the rise of the Old Baltimore Orioles), rather than with those two players, I hoped they might help create a context that helped Dahlen and Wallace seem as relevant to the CoG as later, more familiar players.
So in case anyone who hasn’t looked at those posts may be interested in them, I thought I’d add links to the three parts, which I’m nicknaming Part 1, Part 2, and Part 3.
I expect that in subsequent comments I’ll say more about Dahlen and Wallace specifically. If I become a bore on the subject, feel free to let me know. I won’t be offended; I’m used to it.
One of the quiz answers features prominently in your series.
Indeed. But I’m so hopeless at your quizzes that I didn’t see it before your hint.
Wallace’s stats are so unimpressive it’s hard for me to understand how he accumulated so much WAR.
I’m going to go read your Part 1 through 3 articles in hopes of understanding. But maybe you have an explanation?
The most relevant data would be in Part 3, Joseph, where fielding is a topic, but I don’t deal with Wallace individually.
The period of Wallace’s career saw a dramatic change in fielding standards, and Wallace was a leader of that change. This was a time of very low TTO play: in baseball before Wallace’s career period fielders allowed many more batters to reach base and there was about a 7% likelihood that a chance would lead to an error (by the end of Wallace’s career that figure would be about 4%, an enormous change). Wallace was famous for realizing that infield hits could be turned into outs if the fielder’s throw could be accelerated, and he solved that problem by developing a seamless motion that eliminated the stop-and-set moment from the fielding/throwing process on routine plays, resulting in an improved out rate and thus higher “Range” stats. I can’t really describe the change well because, although baseball histories describe it, it became universal by the end of Wallace’s career and we’ve always seen that sort of fluidity in Major League players. But Wallace’s sure hands and innovative mechanics are behind his high dWAR figures.
On offense, Wallace’s 105 OPS+ seems unimpressive, especially when you compare him with Wagner. But compared with other shortstops, he looks very good. Here are the MLB shortstops, 1901-10, who played at least 800 games, sorted by OPS+:
Wagner 171
George Davis 113
Wallace 111
Kid Elberfeld 106
Freddy Parent 99
Dahlen 96
Terry Turner 95
Joe Tinker 93
Mickey Doolin 82
Monte Cross 70
Tommy Corcoran 67
Take away Superman, and Wallace is on a par with Davis, a CoG member, for the lead. A guy who could bat above average and handle the key infield slot with high skill was (and still is) a precious commodity. (Take away Lajoie too and Wallace will be competitive with all other middle infielders and third basemen.)
You can find a comparable example in Brooks Robinson. His OPS+ is actually a notch lower than Wallace, at 104, but he’s an easy Hall of Famer and CoG member because his innovative work at 3B created exceptional dWAR to supplement his average hitting. Clete Boyer, a Robinson contemporary who was about equally skilled at Third, would have accumulated about as much dWAR in a comparable career, but he wasn’t able to do that because his 86 OPS+ limited his total value.
Thanks for the extensive reply. Makes sense.
2: Russel Martin 57 games
3: Royce Clayton, Monte Cross, Leo Cardenas, George Davis (hmm 4 players?!?)
Main Ballot Vote: Manny Ramirez, Luis Tiant, Kevin Brown
Secondary Ballot Vote: Andy Pettitte, Todd Helton, Andre Dawson
I hadn’t considered 19th century players, but thanks for pointing out Cross and Davis.
4: Angel Pagan hit 64 HR with an OPS+ of 102 and 18.6 oWAR
5; Tony Phillips
7: Steve Bilko in 1958
10: George Burns 1914 (was only third)
John McGraw 1894 (second) and 1895 (third)
It’s McGraw. Burns led the NL with 62 steals in 1914.
11: Topsy Hartsel in 1901 with OPS of .886 and 54 RBI
12: George Brett in his age 22 and 23 seasons
Those were not Brett’s first two seasons as a Royal.
Kevin Seitzer at ages 25 – 26? He did appear in less games than the random RoY limits (in a cup of coffee at age 24) to the extent his second season merited a 2nd place finish in the RoY award voting
How about Amos Otis?
It is Otis.
Emil Brown (who I have absolutely no recollection of) batted .200 in fewer than 500 PA over 5 seasons through age 26, then played only in the minors for 3 years (for four organizations), before landing in KC at age 30 and becoming their regular right-fielder for two seasons, Not your typical road to becoming an everyday player.
Brown was effective at the plate for those seasons, but brutal in the field, turning in the second lowest season Rfield score by a Royal outfielder, ahead of only iron-gloved Danny Tartabull (Kauffman Stadium is not a forgiving ballpark for weak corner outfielders, yet the Royals kept Tartabull out there for 5 years and -64 Rfield).
In looking at Otis’ career, it’s almost shocking how well he fielded in 1978 (+16 runs) compared to the rest of his career (-50 , without a season half as good as 1978). Strangely enough, he also accumulated the most rBat in that season as well with a career high OPS+ of 151.
Hit the cover off the ball in the 1980 WS and followed it up with an 0 for 12 in 1981 playoffs
It always felt like the Indians and Royals played each other about 50 times a year in the 00’s, so I do remember Emil Brown. He was indeed just as atrocious in the field as his Rfield would suggest.
I remember Brown with the Pirates. Shows the merits of second chances…after three years in the minors (ages 27-29), at ages 30-31, he plays everyday for the Royals AAAa team in Kansas City. They managed to lose over 200 games for the years in question (2005-’06). Alas, it looks like they’re doing their level-headed worst to duplicate that type of performance
My ballot is below.
I’ve decided to put in a little bit of work that I haven’t done in a few years. I have always included a (peak-weighted) modified version of Baseball-Reference WAR to determine my votes (with some extra credit given for catchers, as well as the logical considerations of wartime service, racial segregation, etc.). I’ve long thought that I should include Fangraphs’ WAR in my considerations. You might think, “That only matters for pitchers,” but that’s just not true. Sure, Bobby Abreu (60.3, 59.6) looks the same by either measure. But that’s not everybody. Here are three non-pitchers on the ballot right now, bWAR first, fWAR next:
Ken Boyer: 62.8, 54.7
Richie Ashburn: 63.5, 57.6
Ted Simmons: 50.2, 64.9
Uh… those are pretty different. And that doesn’t even count how different the pitchers can look extremely different, as we all know. Here are all three pitchers on the main ballot:
Don Sutton: 68.9, 85.6
Luis Tiant: 65.9, 54.7
Kevin Brown: 68.7, 76.4
So… were these three pitchers all worth roughly the same amount over the course of their career, per Baseball-Reference, or are these three very easy to stratify in terms of career value, a la Fangraphs? I think that, probably, the best thing to do is average the two. Pitchers do not have total control over balls in play; this is absolutely and undeniably true. On the other hand, there is sometimes consistency in batted-ball results, and better pitchers tend to get better batted-ball results than really bad pitchers – plus, it happened, so we should account for it. Fine. So, henceforth, I’m averaging the two. That, for me as a LONG-time Tiant supporter, means that he’s finally losing my support (it’s basically impossible to vote for him given this result.
I will continue not to vote for 19th-century guys, because I don’t believe they were really playing Major League Baseball. Even in the late-1890s, I think it’s unclear that the level of competition was that great. This makes Dahlen and Wallace mildly interesting as candidates, but I don’t plan to vote for them. So here’s my new list:
Kevin Brown
Dick Allen
Graig Nettles
And for the secondary ballot… well, I don’t think any of these guys are electable here in 2019, but here goes:
Rick Reuschel
Todd Helton
Andre Dawson
I will likely make my annual plea for Kevin Brown later, and I may put out some thoughts on the others. But for now, I’ll wait to see other discussion and just post my initial ballot – though I am not unwilling to be convinced to change my ballot before Tuesday if someone can really convince me.
Since I’m playing the role of 1890s-defender, I want to respond to Doom’s comment: “. . . I don’t believe they were really playing Major League Baseball. Even in the late-1890s, I think it’s unclear that the level of competition was that great.” (I originally wrote, “respond briefly,” but when the data changes, I change my mind!)
To take the last part first, level of competition generally rises throughout MLB history. The CoG rules, which try to replicate the psychology of the early BBWAA voters, rather than the rules, assume that there is some significant feature to the year 1901, such that WAR accumulated from 1901 on count towards eligibility and WAR accumulated previously does not. The idea (as I recall it) was that, except for Cy Young and Willie Keeler, the early BBWAA voters acted as though this were a rule, and left earlier players to the Veterans Committee. A secondary function of this was that most BBWAA voters probably knew very little about pre-1901 baseball, because they were too young to recall it, and research tools were inadequate to inform them meaningfully about it. (This was not true of all voters, and some did vote for 19th century players.) Since the CoG was conceived as a project to do the BBWAA project over, and do it better than the BBWAA did, it has never been clear to me why the arbitrary line of 1901, which was, in large part, an informal product of ignorance and laziness, was elevated to a rule.
So the reasons BBWAA voters acted this way was most likely not because of judgments about the level of competition prior to 1901; it was because “baseball as we know it” meant for most of them the two-league structure that began in 1901. That structure, in itself, has little or nothing to do with the nature of the game. Levels of play and of the standard of competitive skill have, by and large, been in a continuous state of improvement since 1876. (The major break in the curve would correspond to the rise in skill levels over the period 1947 to the early 1960s, associated with the integration of baseball and the new pool of formerly excluded black players — a point often made by mosc.) The level of competition in 1965 is clearly far superior to the level of 1905, or 1915, or 1925; yet we treat those earlier eras on the same terms as the later one because player quality has to be assessed in terms of evolving contemporary standards — other wise we’d probably have only a handful of CoG members before the period of integration. In terms of competitiveness, it is very likely the case that there was a drop in competitive levels precisely in 1901, when, after eight years of twelve MLB teams, followed by one year of only eight, MLB suddenly had to fill 16 teams. So in terms of quality of play, 1901 might be the worst year to choose as the start of high-quality ball.
If we could go back to the dawn of the CoG, I’d argue to birtelcom that we should not adopt the arbitrary line that BBWAA did, but should figure out whether we should treat 1876 on as a single continuum, or whether there was, in fact, a true dividing line between “baseball as we know it” and an earlier phase of MLB baseball evolving towards, but not yet, the game we know. I wouldn’t have known it then, but I now believe that the line is quite clear, and that it should be drawn at 1893, for multiple reasons. (No point in reiterating all that here, but the game of the mid- and late 1890s was simply sharply different from the game of the 1880s, and very much consistent with the game of the 1900s.)
Now there’s not a lot of time between 1893 and 1901, but those years are critical to the candidacies of Wallace and Dahlen: they are the two players who have actually been impacted by the fact that, although the CoG rules don’t preclude our considering their play in the 1890s, the way the rules are stated may make it seem as if those years should not be counted. In other words, I think we are replicating the informal error of the BBWAA voters’ psychology when we have all the data necessary to correct the false premise that most of us grew up with: that “modern” baseball suddenly starts in 1901.
I mean, we’ve had this discussion before. But let’s have it again; it’s a fun one.
1. There was no “rule” about pre-1901 balloting. I (and some others) have chosen not to vote for pre-1901 players, partly because we were reliving the BBWAA. They didn’t consider those guys, because that was “a different game.” They had an expert committee. If I can vote for those players, I probably should’ve been writing in Josh Gibson and Bullet Joe Rogan for a LONG time, since A.) I’m sure that the Negro Leagues of the ’30s and ’40s were of higher quality than the 19th century NL, and B.) those players dominated their opponents to a similar or greater extent than Dahlen and Wallace. However, we don’t consider Negro League players, because the BBWAA didn’t consider Negro League players. Likewise, I’ve taken the approach that, if the BBWAA didn’t consider those 19th century guys, the COG becomes less an exercise in re-litigating the BBWAA process, and more an exercise in jst doing whatever we feel like. I realize it’s still not perfect (after all, Ichiro’s been in the COG for a while, and he’s still and active major leaguer), but I’d still like to keep up the fiction that we’re doing the right thing by mimicking the BBWAA.
2. 1901 is certainly NOT the worst year one could pick. First of all, while the AL’s level of competitive balance was all out of whack in 1901, by 1903 at the latest it was on par with the NL. And the NL, while it lost Nap Lajoie, was basically the same league in 1901 that it had been in 1900. In modern baseball, it takes a few years to recover from expansion, because, for a while, the talent pool doesn’t expand, but the number of league players does. That is simply untrue of the 1901 AL. They were taking from a totally separate pool of players, and those players were just as good as the NL players. This is because NL scouting was not remotely like it is now; teams were filled with locals; there were virtually no players from the West or Southeast. It was just a shallow pool. The introduction of the AL EXPANDED the talent, rather than dispersed it, as other rounds of expansion have done. Bill James has written about this extensively.
3.) 1893 would be an okay dividing point, if it weren’t for a couple of things that make 1890s baseball look… bush league. Here are some facts about 1890s baseball:
A. Teams did not play balanced home-road schedules. The 1898 Cleveland Spiders, for example, played 57 home games and 92 road games.
B. Rosters and their rules were not settled. Into the 1890s, there are stories of fans being called out of the stands to play in major league games. That does not sound like major league baseball. It sounds like what I had hoped would happen when I wore my little league uniform to an MLB game when I was 7.
C. Teams didn’t have consistent fields or nicknames. Again, the 1898 Cleveland team had SEVEN home ballparks… and they weren’t all in Cleveland.
D. Cleveland. In 1898, Cleveland posted a record of 81-68. The next year they went 20-134. This does not happen in real Major League baseball. This is what happens in high school sports. Yes, there are teams that crater from one year to the next. Yes, they lost all their key players (Cy Young, Bobby Wallace, Cupid Childs, and Jesse Burkett). But still… that’s ridiculous. It makes the tanking of the late-20th- and early-21st-century Marlins look tame.
E. General conditions were poor. Players weren’t well-compensated, fields weren’t maintained. The general quality of the game was just… poor. Gloves were small or non-existent. Uniforms were strange. I suspect that, for the vast majority of us, the difference between 1895 baseball and 1901 baseball would not only be noticeable, but nearly as stark as the difference between high school and college baseball – even low-level, D3 baseball. You can tell that the quality of the players improves, as well as the field conditions, uniforms, games, etc.
Finally, I will concede that 1901 may not be the best place to put the dividing line: 1920 is probably better. But that’s not how most of baseball history has looked at itself. I think it’s okay to use some inertial reasoning, particularly when engaging in the task of revisiting the Hall of Fame selections of the BBWAA. Ultimately, as I said above, that’s what it comes down to for me. They included Ty Cobb and Honus Wagner? We include Ty Cobb and Honus Wagner. They ignored Wallace and Dahlen? We, or at least I, ignore Wallace and Dahlen. I’m not opposed to including them somewhere; I just don’t think they’re really markedly better choices than Dick Allen or Graig Nettles. Had they been overwhelmingly dominant, they way Cy Young was? Sure. But as it stands, I still don’t have any interest. I’d say I’m less militant and more open to the idea than I used to be, when I was more passionate about what I thought the COG should be, but as the process has gone along and I’ve seen players I wouldn’t have considered worthy go in, I’ve softened and decided that I’m happy to let happen whatever happens. If other folks don’t want to agree with me, that’s fine. If there are others who are more skeptical of 19th century baseball… well, all the better for the Ken Boyers of the world!
(PS: I thought I should mention this. bWAR sees no difference between Wallace (76.3, pitching inclusive) and Dahlen (75.3). But as I was exploring Fangraphs yesterday and the day before, I noticed that fWAR sees a pretty big difference between the two: 77.4 for Dahlen and 68.2 for Wallace. That’s nearly more than a 10-win swing from Baseball-Reference’s opinion if you’re comparing the two directly… and only 0.3 of that is explained by pitching, so that is NOT the answer. Just a thought for those who are having trouble deciding WHICH unworthy – he said, tongue planted firmly in cheek – 19th century SS they’d rather elect.)
Doom, You make some good points: The low point of 1901 was quickly repaired and in a few years MLB did cast a broader net for talent. (But 1901 was a low point.) The syndicate baseball year of 1899 produced the absurd anomaly of the Cleveland Outcasts, and competitive balance was disrupted as a result (though no other syndicate result was extreme, and 1899 was the only year of syndicate baseball).
Let me respond to your other points by number.
1. You say that the BBWAA didn’t vote for 19th century players because baseball then was “a different game.” I think there is no evidence that this is the reason they didn’t vote for 19th century players. In fact, they did vote for Keeler and Ed Delahanty from the start, and that sure wasn’t because of their 20th century records. I think it’s clear that some voters (Keeler wasa elected in ’39; Delahanty got over 50% in ’38) voted for those guys because they were great in the 1890s, and that no one was thinking in terms of whether 1890s ball was “a different game.” I don’t see any analogy to the Negro Leagues. I think the CoG goal was indeed to relitigate the BBWAA voting, and one of the first things to relitigate, for me, would be why Keeler (54.1 WAR) was elected and not his exact contemporaries Dahlen (75.2) and Wallace (70.2). Delahanty (69.7) was, of course, an earlier player than any of them.
2. I grant your main points, though if you’re going to lay stress on the abnormalities of one year, 1899, on one side of the divide, and use it to delegitimize all the years in that decade, I think you’d need to concede the poor quallity of average talent in 1901 and argue why that year doesn’t delegitimize its decade as well. (In fact, neither year delegitimizes either decade, but the low quality of 1901 does make it a poor choice as the year when baseball is suddenly no longer “a different game.”)
3. I think this is a grab-bag of irrelevant stuff. What difference does it make if uniforms varied or were silly (think of Bill Veeck’s White Sox in shorts!)? What difference does it make to the game if some teams played in multiple stadiums? In 1956-57, the Brooklyn Dodgers played some regular season games in an indoor stadium in Jersey City — how could that be in the modern game? Teams had multiple nicknames? So what — newspapers referred to teams by variant nicknames for years after; how does that affect the game itself? Yes, there are rare examples of games where fans were recruited out of the stands in the 1890s, and there were in the 1900s too. Players were poorly compensated and fields poorly maintained in the 1890s — and for two decades after. Gloves were universal among position players by 1893, with one exception (I think I recall that a couple of pitchers persisted without one into the mid-1890s), and their size and design changed gradually from then on — there was no leap in 1901 or thereabouts. The 1890s are, in fact, the era when baseball’s defensive skills coalesce, and the earlier defensive free-for-all comes to an end (of course, improvements have continued in every decade since). I think there is nothing to substantiate your claim that the game of 1901 was dramatically or even significantly different from the game of 1895: there’s just no evidence to support it. What there is evidence to support is that the game of 1890 was dramatically different from the game of 1895. I’m sure you must know the reasons why that was so.
In my view, you are as well or better informed about baseball than anyone else contributing to this site, and I don’t believe I know half as much as you. And you’re as free as anyone to vote as you choose for the CoG. If you find Dahlen and Wallace — and 1890s baseball — of little interest, then so be it. But I think when you support your lack of interest with arguments, they are not at all up to your usual standard, and I’d guess this may be precisely because the issue is one you are not deeply interested in engaging.
Fair enough. I want to make a couple of points.
First, about the grab-bag. I don’t disagree that this is a grab-bag; I don’t disagree that it’s irrelevant. However, think about this: do top-tier leagues share these features? They do not. They simply don’t; as quality of play improves, so do these other features; it’s inevitable. The game of the first decade of the twentieth century was radically improved from the game of the last decade of the 19th in all of these regards.
Second, a minor quibble: you say that I pointed to 1899, a famously rough year in the NL. I intentionally chose 1898, the year prior, because I didn’t want to use the story of the 1899, 134-loss Cleveland team. Each year in the 1890s had just as many anomalies.
The primary point I would make, though, is the point about who the voters considered. Yes, Keeler and Delahanty were both considered by SOME voters, but only Keeler and Young were ever elected by the BBWAA. The BBWAA did in fact know about the existence of the Old Timers’ Committee. The voters did not know about who was supposed to be considered by which committee; this explains Cy Young’s lack of support in the first election (he would’ve made sense in that first class otherwise, one would think). BTW, for what it’s worth, I didn’t vote for Wee Willie, even though the voters did.
My point with the Negro Leagues was not that the leagues were or weren’t analogous; it was that they share a feature: BBWAA voters did not consider these players to be in their purview. I simply wanted to do the same. Please, feel free to vote for them; I will not stop you, nor try to convince you. I just don’t plan to vote for them. I just can’t bring myself to do it; not yet, anyway. But feel free to try to convince me!
Well, Doom, if the series last spring didn’t convince you, or at least pique your interest, I think it would be futile to try to do so here. Really, that’s pretty much all I got. But the focus of the series was on changes in the game itself, not on the ancillary features that you take to be a certain index of game quality.
When you say, “Do top tier leagues share these features?” I think the answer in the 1890s is obviously, “yes,” and the answer in later decades is increasingly, “no.” But this is not a mystery: the game is in a steady state of improvement, always leaving some features behind decade by decade. The question concerns where the line can be drawn between Early and Modern, if it can be. When you look at the game itself, rather than the trimmings, it does appear that the line can be drawn, and the year is 1893. If you want to make the trimmings the measure, perhaps there’s another line to draw, although I don’t think it can be 1901, and I see no data that suggest any other — I think that after 1893, it’s all relatively steady evolution in quality until 1947-60, although there are certainly style changes that come and go, sometimes abruptly.
I blew by this really good exchange between you and Doom when it happened a couple days ago.
Something I’ve felt for a long time (and used to post about when I was here regularly) is that I believe that your characterization is roughly correct — that the quality of play has been going up over time, and that the curve is especially steep between 1947 and 1960. But I think it was also pretty steep between 1900 and 1930. I agree with Doom that 1920 might be as good a starting point as 1900. Things don’t really feel “major league” until you’re well into or coming out of the deadball era, and even in the 1920s and 30s, it was still pretty common for a replacement player to basically be a semi-pro, rather than pulled from a large field of just-below major league level players who were studying ad playing the game full time trying to make the show. Even major league regulars, if they weren’t stars, often weren’t paid enough not to moonlight or take off-season jobs.
Because of the history, and the reverence we have for the greats of those eras, I’m not willing to write them out completely, and I do think that you have to look at greatness in comparison to what people faced at the time to some degree. Yet I do look much differently on the 65-75 WAR accumulated by a deadball or even 1920-30s player vs. a player who played their whole career post-integration. I’m much more passionate about my choices among borderline 1960-2000s players, and I don’t/didn’t really support the candidacies of anyone pre-integration who doesn’t have inner-circle numbers or peaks. So yeah, of course, Musial and Speaker and Wagner and Walter Johnson/Cy Young/Cobb, etc. But I seriously wonder if even some of them would have put up more than 70-80 WAR against a replacement level comparable to 1960 or 1990 baseball.
This is why I never voted for Greenberg or Sisler either. I didn’t really follow the idea that we shouldn’t vote for Negro League greats. Paige ended up in, and I remember endless debates about Miñoso and Doby, Campanella (who ended up in) and Mosc’s favorite Monte Irvin, all of whose raw MLB stats run from clearly below the line to barely borderline, but I supported them, and if guys like Gibson or Rogan had ever had enough of a write-in following to get and stay on the ballot, I’d have been pushing them too.
In general I feel the same way as Doom, but I would go further and extend it to nearly all pre-integration players. I would prefer voting in any of our post-integration holdovers, including a couple guys on the second ballot and a couple more that can only come back in a redemption round to Dahlen and Wallace.
I also think Allen’s clubhouse cancer rep needs a bit of a review in light the casual racism that was pretty common in those days and, well, apparently still pretty common among a large share of the population today. Maybe he was an asshole. Or maybe he had a bit more human frailty and difficulty facing a still pretty gruesome situation than some of the paragons we worship from earlier times.
Anyway, that’s my two cents. I vaguely remember doing some analysis in comments years ago to try to figure what kind of WAR/WAA adjustments I should make as we were starting to get pre-integration players on the COG ballot. IIRC, it wasn’t impossible to finesse a range of reasonable adjustment.
A very thoughtful post, Michael. The point of view you’re expressing makes perfectly good sense, but I believe that the price of adopting it is to unnecessarily devalue baseball’s entire history, relegating it to a prelude to the present, which will someday in the future do the same to today’s players.
Baseball differs from other professional sports in the degree to which its history is expressed through the length, detail, and integrity of its statistical record. No other sport debates the relative worth of its history of players to the degree baseball does because the early data is too sparse and the games have changed too radically to provide a comparably even playing field for measurement. This, to me, is what makes baseball so supremely engaging.
If the question the CoG asks is, “Who are, in absolute terms, the best players ever?” then I wonder whether a single player from the eras before, say, 1950 or 1960 — or perhaps even later — would be elected. Not one of them had a training regime anything like today’s players; none had the nutrition or medical care; none of the hitters had to face a string of pitchers each game who were capable of throwing 90+ MPH, pitch after pitch; none of the pitchers faced hitters with the disciplined skills necessary to face such pitchers. Baseball has striven to get better every decade and it has. The realized abilities of the players, expressed in their stats, have always been 100% relative: relative to the quality of the competitive environment in which they played. It has to be so and it always will be.
I don’t think this vision of baseball as continually getting better was central to Major League baseball in the 1870s or 1880s. I think during those periods it was a peripheral thought. The main focus was on assembling talent — giving the ball to the hardest throwing or craftiest pitchers, having the best hitting team you could hire and letting it hit away, and keeping your fielders alert to respond to BiPs with concentration. A few team leaders, notably Charlie Comiskey, were early adopters of approaches like serious physical training and mastery of in-game tactics, but it was not until the early 1890s that the approach of continuous improvement through training, innovation, and strategy became universal, driving changes in the game ever since. That development also corresponds to the last of the major rule changes that gave baseball the look and structure of today’s game: the alteration of the diamond’s geography. My view, which I articulated at too great length in my series last spring, is that the new baseball approach pioneered by team leaders of the early and mid-1890s put baseball on the path to permanent improvement, in general making each decade seem obsolescent once it was past, and guaranteeing that no matter how extraordinary a player’s skills might be, within a few decades they would become an ordinary standard. Think how many pitchers today throw with acceptable accuracy at speeds beyond what Walter Johnson or Bob Feller threw at — are they all greater players? Think about what Babe Ruth’s career OPS+ of 206 — 106% better than league average — would translate into if that increasingly fat and pleasure-distracted player were playing in a Major League today, where a 100 OPS+ is so far beyond the 1920s/30s average hitter’s skill.
Players don’t get to choose the era they play in or the conditions that frame the training and competition they encounter. It seems reasonable to believe that had competition been keener in 1890, 1900, 1910, and so forth — more skilled and more strategic — the good players of that era would have raised their games to meet it. In fact, that is what always did happen, as baseball evolved for the better. Had Ty Cobb been forced to play in an integrated era with the best talent from the Negro Leagues and from other ball fields where, in the real world, talent had no opportunity to rise (and with the poorest of white Major Leaguers removed and relegated to the Minors), he would have faced greater challenges, and, I expect, being Ty Cobb, would have risen some distance towards overcoming them (and, I’m sure, would have become a better person as well). Well, perhaps, or perhaps not: the real world gives us only one version of baseball history. (And, as someone who pushed as hard as I could for Paige’s inclusion, despite CoG rules excluding him, I’d be happy to support an expansion of the CoG with Negro League player, so long as one or more of us studies up enough to help all of us make sure we vote responsibly.)
If we want to retain the meaningfulness of baseball history as a continuous body of statistical results and not just as a narrative of seasons, then I think we have to accept statistics across time as legitimate in their expression of accomplishment relative to era. Otherwise, all those post-1960 stars you feel enthusiasm for today will turn out to have been second raters when we reach the post-2060 era. We may or may not like the game of 2060 (I know I won’t like it, because I’ll never see it), but it’s a cinch that the game skills of the players will be a quantum leap beyond what we see in our present: the dynamic of MLB as a business and a sport ensures it.
I should be clear — I really don’t mean to take the tack that we should be looking at absolute value! In that case, you’re right that we’d probably have to ignore everybody that wasn’t outerworldly from before 1960ish, and how do you even know — is Ruth comparable to Barry Bonds, or Albert Belle, or some dude that never made it out of AAA?
So I still want to compare people to the era they played in, but I don’t like seeing what seem like inflated WAR totals based on the fact that replacement players were much further below the standards of the stars in those days than today (or any time post-integration).
When I talked about this a few years ago, as the original voting was getting to players who played a lot of their career pre-1947, I proposed an adjustment based on the difference between average and replacement for the years people played. This was also relevant to discussion of Hal Newhouser and a few other candidates who played during the war years and put up big numbers against reduced competition.
So for instance, Chipper Jones gets 327 replacement runs which is 30.8 per 1000 PAs, while George Sisler gets 35.4/1000 PAs. When talking about cross era comparisons, I’m not sure why we should be giving guys for their league having a wider difference between replacement and average.
And I think this still undercounts the difference pretty heavily, because the *average* player in 1900 was not a full time professional either, and the average standard went up dramatically post integration. I’d ideally like to be comparing earlier players to what “should have been” replacement level and average level” if the league had been full of pros with no color barrier. Now, how to do that statistically is not an easy (or probably even possible) question to answer, but that’s what I’m aiming for, not an absolute standard of play. By absolute standards (what would they do in today’s major leagues if you somehow time traveled them to 2019?), it’s arguable whether even Ruth/Williams/Young/Johnson/etc. get in, which I agree would be ludicrous and not what I’m talking about at all.
Michael, This sounds a lot more interesting. You seem to be interested in analyzing competitive balance, and for that we’d need to assemble curves for each season, plotting the distributions of OPS+ and ERA+. Wouldn’t the notion then change from a steady improvement of skills and performance to a more rapid rise in quality among the least talented, with average talent rising in quality faster than outstanding talent?
If that’s the model, wouldn’t we expect the highest career OPS+/ERA+ figures to come disproportionately from the early (or perhaps early and PED) eras? At a first glance, that does not seem to be a clear pattern in actual career leaderboads.
But this sort of math isn’t my area, so I’ll hope you correct my understanding. In principle, your idea seems on track to me.
(I think your idea would hold equally for the PED era. Those using PEDs changed the balance of competition relative to clean players, who more closely resembled replacement-level relative to the pumped leaders, even if median talent levels were, in absolute terms, holding steady.)
Main ballot-Boyer, Ashburn, Dahlen
Secondary-Dawson, Randolph, Helton
Before we get back to the dogfight over the same 10 or 15 marginally acceptable COG entries that have been on ballots for what is now literally years, I’m going to try to probe the worthiness for inclusion in this group of Bobby Abreau by comparing his record with that of someone already in the group, Dwight Evans.
Both played right field, both had long careers, both hit for medium power for their eras, Evans a little more. Other similarities: Both walked a lot, Abreau early in his career while with Houston especially, Evans later. OPS+ Abreau 128, Evans 127. Both performed better at home than away by about the same margin.
Despite the superficial similarities of some of their career statistics—they are very close in OPS+, as noted, but also in oWAR (61.6/60.5), Runs (1453/1470), Hits (2470/2446), RBIs (1363/1391)—they were dissimilar players in most respects. Abreau batted left, Evans right. Abreau stole 19 bases at age 24 and 21 at age 37, averaging 27 per 162 games. Evans was no threat on the bases, although he wasn’t a slow runner. Evans was much the better fielder, garnering eight Gold Gloves in ten years. It is this defensive superiority that gives him the final edge in career WAR, 67.1/60.0. Abreau hit for average early on, and at age 30 his cumulative BA was .305, which dwindled to .291 by career’s end. Evans at age 30 was batting .269, which he boosted to .272 by career’s end. And this difference is indicative of the telling fact that whereas Abreau’s career was made in his twenties, Evans’s career as a prominent force only began in his age 29 season.
Abreau has not been retired long enough for HOF consideration, but it seems likely that he will make a much more impressive show there than Evans, who was off the ballot after three years, his best total being 10.4% of the votes in 1998. Nonetheless, in his time Evans was, I think, regarded as a much more accomplished player, garnering MVP consideration 5 times, finishing third, fourth, seventh, ninth, and eleventh. Abreau, while making seven MVP ballots, finished no higher than twelfth, the other totals bringing him in 14th, 16th, 17th, 23rd twice, and 27th. JAWS ranks Evans fifteenth among right fielders—two positions above Ichiro, incidentally. Abreau holds the twentieth spot. As a cross check, per Dr. Doom, FanGraphs give Abreau 59.6 WAR, Evans, 65.1.
Well presented, nsb.
I was hedging on whether to give a vote to Abreu but, as you’ve demonstrated, he just seemed to come up a little short.
I’ve found the 65 WAR test (maybe 55 WAR for catchers) to be pretty reliable in guiding my selections. Most above that line seem to merit serious consideration as borderline candidates, most below somehow not.
Well-put, nsb. BTW, Abreu (0.7) and Evans (2.3) have two of the smallest differentials on the ballot between bWAR and fWAR. Only Dahlen (2.1) slides between them, with Nettles (2.3) having the same difference as Evans. Another player we’ll see this year in the balloting (Jeter, 0.2 difference); but he’s not here yet. The biggest differences belong to Tiant (11.2), Secondary Ballot candidate Ted Lyons (12.7), and Don Sutton, who is unrecognizable between the two systems at a difference of a whopping 16.7 WAR.
As for HOF voting, I expect Abreu won’t do much better than Evans did. I probably wouldn’t vote for him; I certainly won’t for the COG.
12: Amos Otis in his 23 and 24 age seasons comming from the Mets
PS: Q6: Postseason search is very difficult on BR;-)
Like you, I sure wish there was a P-I Season Finder for the post-season. But, question 6 is not difficult to solve with P-I Game Finder.
Indeed it is easy to find John Rocker with his perfect 0.00 ERA in 20 games with the P-I Game Finder :-/
But i didn’t even think about searching for a career stat with the game finder;-)
Of course, if you have the patience and wherewithal, you could create your own PI post-season finder.
This is Bruce Gilbert: my main ballot picks are Don Sutton, Ted Simmons and Dwight Evans. My Secondary threesome is Ted Lyons, Andre Dawson and Andy Pettite.
Doom has raised the issue of whether we should consult Fangraphs WAR. I have a very strong objection to fWAR for pitchers — I could explain those objections again, but I won’t — but it seems to me reasonable to consider fWAR for position players. Here is the list of the current main ballot position players, with fWAR indicated:
Abreu (59.6)
Allen (61.3)
Ashburn (57.6)
Boyer (54.7)
Dahlen (77.5)
Evans (65.1)
Nettles (65.7)
Ramirez (66.3)
Simmons (64.9)
Wallace (62.4)
Wallace has an additional 5.8 for his pitching, but since I don’t believe fWAR is reliable for pitchers, I have not added it in.
So, I started to write a comment about the dramatic difference in Simmon’s fWAR v. bWAR and what it might mean — perhaps fWAR takes framing into account (no), or some other stat that makes a big difference. I went over to fangraphs (which I don’t visit as often as b-r) to check on what exactly goes into their catcher WAR, and then look at Simmon’s chart to make sense of the differences, and what I found was that it was much simpler — looks like Bob made a typo — Simmon’s fWAR is 54.2 (needs a catcher adjustment to be COG material), not 64.9 (would normally represent borderline for any position player).
BTW, I agree with your objection to fWAR for pitchers. It assumes the pitcher has *nothing* to do with results on balls in play which seems absurd on it’s face, and isn’t really supported by sufficient evidence to take seriously as a measure of pitcher performance (BABIP year to year correlation for pitchers is low, but not effectively zero).
I do think there’s enough question about just how much effect a pitcher has on balls in play, that it’s worth looking at fWAR for borderline cases, but I take it much less seriously than I do bWAR. While for position players, it’s probably reasonable to average them.
You’e right, Michael: Simmons’ fWAR figure was a typo. Sorry! Wish I could get in there and correct it. (Doug . . . ?)
I agree with you on fWAR for pitchers. I think B-R takes the right approach by calculating the quality of the defense behind pitchers and adjusting on that basis. Although there are plenty of flaws in defensive stats and another layer of problems in applying season defensive stats in a blanket way, it’s certainly far better than evaluating pitchers without to BiP outcomes, which generally constitute more than half of each game.
OMG, I don’t think I can cope with this so sooooooon. Miguel Cairo does look tempting.
Must be those 150 games at 1B, 2B and 3B, putting Cairo in a group of 13 including luminaries like Pete Rose, Jackie Robinson, Paul Molitor and Matt Carpenter. Alas, Cairo more closely resembles the five others in that group who, like Cairo, also have 150 games pinch-hitting: names like Scott Spiezio, Ty Wigginton and Dalton Jones, the last famous for his PH exploits in the Red Sox pennant chase of 1967, but not much else.
Cairo and Spiezio sounds like a Personal Injury law firm. ‘Spiked at second? Call us to find out what your case is worth.”
~ 50 years later, I can still hear Curt Gowdy on his Saturday soap box speaking in ridiculously glowing terms about Dalton Jones. You’d have thought Jones was the second coming of Ted Williams.
Later, Gowdy switched allegiances and spoke about O’s prospects at Rochester (?), Grich, Coggins, Bumbry, and Baylor, etc…as if their super-stardom was a foregone conclusion and inevitability.
Well Grich is a pretty good call — if you choose a random 5 top prospects from a single team, what are the chances one of them becomes a hall of famer? Oh, right, those fsckers still haven’t put him in, so let’s say COGer instead.
Michael Sullivan
Well, actually, since even Coggins did contribute to some degree at the major league level, I guess Gowdy’s enthusiasm was warranted. However, I don’t believe I ever heard him speak of any other organization’s prospects in such glowing terms. IIRC, Hank Peters or Frank Cashen or whomever was running the show for Baltimore back then didn’t make too many mistakes in those days. Their biggest (and only ?) blunder may have been thinking Rettenmund was going to replace Frank Robinson
Curious splits for Dalton.
– as PH or 3B, 529 games, .265/.326/.379
– as 1B or 2B, 417 games, .215/.276/.323
There’s a little bit of double-counting in there, but this covers almost all his career. Seems like two different hitters. And, it’s not as if these are different periods in his career, as he played all of these positions throughout his career. Strange!
Doug,
That first split may have been good for an OPS+ greater than 100 in those dead-ball days…the second? Not good
The other odd thing is that each of the good slash figures is about 50 points more than the corresponding bad one. So, Jones walked about as often and had the same ISO in both situations; he was just a lot better at hitting singles as a pinch-hitter or third baseman which, in the case of pinch-hitting, sort of makes sense.
Vote Cairo! He was an original Devil Ray! He somehow played for 9 franchises in 17 seasons! He had two stints with the Cubs… and the Cardinals… and the Yankees! He had two different seasons in which he played first, second, short, third, left, right, and DH! He had double-digit sac bunts three times! More career WAR (7.7) than Willie Bloomquist (1.6)! He led the league in Range Factor per 9 among second basemen in 1999! He had the third-best dWAR in the AL in 1998! He once stole 28 bases (2000)! He nearly managed double-digit homers once (8 in 2011)! Vote Cairo!
Off Topic: Some of you may remember that I taped Jeopardy! a couple months ago. My show is finally airing – tomorrow, January 25th! If you are able to watch and cheer me on, I’d very much appreciate it. I’m Steven, the contestant on the right-most podium.
Glad you posted this reminder here, CC, since the CoG posts generally bring in a wider HHS group. Hopefully, some of our long-lost friends will return over the next day (or over the next few days, if they have cable access to past shows) and learn about your breakthrough as the first HHS regular to do combat on Jeopardy! I know the show was taped awhile back, but, nevertheless, Good Luck!
Thanks, Cursed. If I can get home in time, I’ll tune in and cheer.
Oh man. Is there a way to stream this? I cut the cord but I would love to watch this. What network is Jeopardy even on? I’ll find some way to watch it tonight!
For people without TVs, I have a link to the episode on Dailymotion I can post after it airs.
Please do, would be fun to watch.
First post in this reddit thread has links: https://www.reddit.com/r/Jeopardy/comments/ajmf2m/jeopardy_recap_for_fri_jan_25/
Very nice! Congrats! So you’ll be on again as the champ? Love the confidence and game theory with your bid on final to guarantee the win if you get it right.
Hey, Jeopardy question, as someone who’s clearly pretty good at the game, if you don’t mind answering: For playing successfully, based on your sample size of presumably one to a few rounds — How would you balance the value of these various things in percentages or ratios:
1. Knowing the answers (at least within the time limits)
2. Knowing the answers instantly or super quickly.
3. Timing the buzzer to get in.
4. Game strategy (question picking, bet sizes),
5. Avoiding performance jitters.
6. some important factor I’ve failed to mention.
I haven’t watched the show in years, but I’m always fascinated by games and strategy. I have a suspicion that buzzer timing is really important, since I often know most of the answers, and it seems as though all of the good players like you do as well. Even Christopher, who was clearly a step behind you and the other guy, seemed to be pretty solid — I get the sense they rarely pick contestants who aren’t really good at trivia in general.
I’d say about 60% buzzer, and then a mix of knowledge and nerves. Like you noted, everyone on the show knows a ton. It’s all about being able to buzz ahead of people, and keeping your cool so that you don’t blank on the things you know.
Does the buzzer penalize you for buzzing early? Is there some deterrent for buzzing before the question is complete?
CC
You da man! That was some second half performance by you! I’m a little surprised no one else got the final jeopardy question correct but no matter since you wagered enough to cover even a correct answer from them. Again, congratulations!!
I think a lot of the questions I would know the answer but I could never formulate it that quickly. I get tongue tied so easily. Especially under stress, it’s a staggering skill.
I loved “Pikachoooooo”! I’m glad they didn’t make you answer that as a question.
Steve-O! I had to drive across Canada for a funeral last weekend so even though I had it marked in my calendar I had to catch up in the last couple of days. Congrats on a good run! Very close on the second game too, if you had gone into Final with the lead you would’ve got it, but a worthy opponent. As someone who has friends that are Jeopardy fanatics, it was exciting to tell them about it and have someone to root for.
This is going to be a long one:
Here is a comparison of some essential career stats of this round of contenders for the Circle of Greats versus those of select COG members —those who aren’t in the HOF, who aren’t currently ineligible for the HOF, and who aren’t named Bonds or Clemens.
First, position players.
WAR, PA, and OPS+ mean just what they say.
HOS is the rating given to the player at Adam Darowski’s Hall of Stats.
The final stat is my own corrective to what I see as the tendency of both WAR and the HOS rating to over-value career longevity: WAR per plate appearance ( x 10000 to make it easier to comprehend in a chart).
Player———–WAR————-PA——- OPS+—HOS—-WAR/PA
_______________________________________________________________
Grich———–70.9(16.8)——8220——125——140——86.25**COG
Whitaker——74.9(16.3)——9967—–117——145——75.15**COG
Walker———72.4(2.0)——-8030——141——152——90.16**COG
Lofton———68.2(15.5)—–9235——107——133——73.85**COG
Allen———-58.7(-16.3)—-7315——156——117——80.25
Ramirez——69.4(-21.7)—-9774——154——130——71.00
Nettles——-68.0(21.4)—-10228—–110——126——66.48
Ashburn—–63.9(5.4)——9736——-111——119——65.63
Evans——–67.1(-3.8)—-10569——127——124——63.49
Boyer——–62.8(10.7)—–8272——116——118——75.92
Simmons—50.3(5.2)——9685——-118——112——51.94
Dawson—–64.8(1.6)—–10769——119——123——60.17
Randolph—65.9(20.2)—–9461——104——124——69.65
Helton——-61.2(-5.5)——9453——133——120——64.74
Abreu——-60.0(-11.1)—10081——128——110——59.52
Now the pitchers.
The relevant stats here are WAR, IP, ERA+, HOS rating, and pWAR per inning pitched (x 1000) again to be a slight corrective to overvaluing career longevity.
Player———-pWAR——-IP———-ERA+—-HOS—-pWAR/IP
_________________________________________________________
Ferrell———–48.8——2623.0——116——112——18.60**COG
Schilling——–80.7——3261.0——127——171——24.75**COG
Brown———-68.4——3256.1——127——137——21.00
Tiant————66.1——3486.1——114——129——18.96
Sutton———-68.6——5282.1——108——112——12.99
Lyons———–67.6——4158.2——118——126——16.26
Reuschel——68.3——3548.1——114——136——19.25
Pettitte——–60.7——3316.0——117——108——18.30
Hope this comes out all right and makes some sense as a means to see not only how candidates match up with one another, but how they compare to some players already chosen.
What it does not do is fill in the details of each players virtues and liabilities: Ferrell’s batting prowess, Ramirez’s considerable baggage, etc.
nsb, I notice Dahlen and Wallace are not included on your list. Here are their stats (I assume the parenthetical figure next to WAR is dWAR):
Dahlen——-75.2 (28.5)—-10411—-110—–145—–72.2
Wallace——70.2 (28.7)——9617—-105—–145—–73.0 . . . (pitching 6.1—402—-125—-xxx—–15.17)
Right. The chart took so long to lay out that my brain failed more seriously than normal, and I forgot to mention those facts. Nothing against the dead-ball guys—I just wanted to focus, to be honest, on the way the live-ball position players don’t match up to the live-ball COG inductees not in the Hall. With the pitchers, the ‘pitchur’—as we illiterati say—is clouded by Ferrell’s inclusion, since his hitting put him over the top.
The question of how we should view career longevity is not simple. In general, we could think of comparing players with comparable qualifications for the CoG and significantly different career lengths as a contest between a player making his case on the basis of the high quality of his realized potential and a player making his case on the basis of total accomplishment. There is something to be said for each measure, and nsb’s table gives us both. (I’ve been using WAR per G and qualifying season for rate measures in my tables, but I’m jealous of nsb’s approach because, for hitters, his figures put the cumulative and rate stats on the same scale.)
In recent CoG rounds, I’ve been increasingly tempted to vote for Dick Allen (and may have done so) — his WAR rate, as nsb shows, is terrific, leading everyone. But Allen’s high rate is a product of a short period of decline: he essentially walked away from the game at age 35, in part because he was fed up, but probably in larger part because he was washed up. After age 32, he produced only 0.4 WAR over three seasons (1020 PA, about 14% of his career). That sort of an ending reduced his total accomplishment, but it also preserved most of his high rate-stat profile.
By contrast, in his age 36-40 seasons Graig Nettles (whom I haven’t voted for, but who makes a nice contrast) produced 11.6 WAR (compared to Allen’s zero): a substantial contribution, but well below his rate in his prime. (He also stayed too long, contributing -0.6 WAR in age 41-43 seasons he might have done better to forego.) If you compared Allen and Nettles, counting Allen’s age 36-40 WAR as 0.0 (or age 36-43, to be more complete), I don’t think that would give us a better way to look at Allen vs. Nettles, but I think it would add a perspective of some value in making a well reasoned comparison. (Of course, Allen’s real WAR in those seasons wasn’t 0.0, it was X.X, but a numerical notion helps the thought experiment.)
It’s interesting; I guess I would argue that WAR itself already accounts for playing time on a seasonal basis. I mean, there are two reasons to use WAR rather than WAA. First, average players have value. A team made up entirely of average players will nearly make the playoffs – add in another star, and you’ve got a good shot at a Wild Card. But the second reason to use replacement rather than average is that it accounts for playing time. Is it better to be 50% better than average and only play 50% of the season, or is it better to be 20% above average and play the full season? WAR can answer those questions more satisfyingly than WAA.
When we’re looking at a career rate, I guess I would argue that looking at WAR in rate form is not really the most effective way of looking at it, since WAR itself already accounts for disparities in playing time. Bob, in the example you site, Dick Allen’s 36-43 WAR was 0.0 – he didn’t contribute anything. You can certainly look at it as a rate stat… but why bother? Better, I think, not to punish Nettles for ages 42-43, and just compare them through age 41. Why bother checking rates at all? We know how much WAR they accumulated through that age. That puts Nettles 10.1 wins ahead. You don’t have to modify it or look at it as a rate stat. (Incidentally, if you look at Fangraphs, the gap is only 5 WAR; but that’s not the point here).
Another way to look at it is to take players only during those seasons in which they overlapped; there are MANY weaknesses to this approach, as I’m sure you don’t need me to explain. But both Nettles and Allen were in the league ages 22-35. In that period, Allen out-WARs Nettles 58.8-56.9. This approach doesn’t “punish” Nettles for hang-on years. On the other hand, Nettles was in the league ages 22-24, but didn’t play 100 games until his age-25 season (he played 96 as a 24-year-old). Still, maybe 24-35 is more fair. In that span, Nettles out-WARs Allen massively: 55.9-43.6; of course, we’ve also eliminated two of Dick Allen’s top 4 seasons in so doing, simply because Nettles was not effective at those ages, which hardly seems fair.
Point is, there are lots of ways you can slice it to account for this difference. There are those who favor WAA+, or a JAWS-style system in which you look at top 7; when Bill James did the NBJHBA, he did a weighted average of total, top 3 overall, and top 5 consecutive; Hall of Stats combines WAR and WAA. I have my own method of weighting, which, incidentally, has those two almost exactly equal: 67.2 for Allen, 67.0 for Nettles. That’s a total wash. But then, that’s because I try to give peak credit by weighting peak seasons more, in a similar (but better, I would argue) way to those methods listed above. (My proudest moment as an online baseball nerd was having my method displayed on Tango’s Hall of Fame selector; you’ll find it as fDoom for Fangraphs WAR or rDoom for Baseball-Reference WAR. I will never be tired of the fact that it exists that way.)
In conclusion, there’s really no way to do this perfectly, but I don’t think WAR as a rate stat really does what we want it to do. The statistic itself, on a seasonal level, already accounts for differences in playing time. On a career level, it’s not perfect, but I think WAR still does a good job of accounting for different career lengths.
What a well thought, cogent post! I’m going to have to catch up over time to really test out some of your ideas so that I fully understand them, but you carried me along well enough for a first take.
One detail: I do think assuming that a non-playing player earns 0.0 is only a strategy of convenience. As you say about Allen in his post-age-35 seasons, he was contributing nothing. But a player with 0.0 WAR contributes at replacement level. They’re different levels of contribution, I think. I’d be thrilled to think I’ve racked up scores of 0.0 WAR seasons; if you put me on the field for an actual inning, I’d be in negative territory the moment I appeared at the plate or had a fielding chance.
I think the consensus is that below average WAR is mostly the Team’s fault. They do not have the talent or the analysis to deploy what is expected as a major league level minimum. I discount any negative WAR from a player’s career. I find it unnecessarily cruel. If the team wants the player to play, they must think he’s better than a replacement. If he’s not better, that’s on the team.
To me, WAA is very valuable for this specific conversation. You’re not talking about comparing players that are on either side of average, you’re talking about comparing the dominance of history’s finest against each other. The “bar”, so to speak, can be raised. Replacement level won’t cut it. Average won’t really cut it either (but it does make a nice bar). How much BETTER than your average ballplayer were these guys, and for how long.
WAA+ removes the negative again, you’re only looking at their positive contributions. History’s best tended to love the game and their talents were often visible at a young age. That means they often debut’d before they were stars and played for years afterwards. WAA+ nicely focuses on their contributions that exceed the norm.
I agree with Doom, although not exactly his statistical flavoring, that the impact of a player’s peak is more meaningful than their career accumulation. A player’s best is what they did at their best and that is not a 20 year period (unless you’re Willie Mays). In addition to WAA+, I like weighting peak years.
No stat is perfect. You still have to adjust for lots of other factors. Defense stats sucked before 2013 or so IMHO and only make sense on a 3-year average. Steroids helped those who used them and disadvantaged others. Racism, not a lack of talent, played a role in the career lengths of too many all-time greats. Coors field (pre-humidor) breaks the statistical model and is too much of an outlier to not address. There are many other things to keep in mind as well.
But yeah, I like rDOOM too.
mosc, I take WAA+ into account as one measure I consider (entirely because of your repeated arguments, which I think have merit). But I disagree that it is the fault of the team and not the player when he earns negative WAR. Perhaps I really don’t understand the argument, since you say it may be a consensus one.
Look at Albert in recent years. Of course the Angels could let him go and eat his contract, but they’d have to pay additional money for a replacement, and while a replacement might be better, if it’s a new player that’s a gamble, if it’s an established player the cost goes up further for a team stretched thin by Albert’s contract, and in either case the Angels lose the attendance that Albert still draws. It is a difficult call for the Angels. Regardless, Albert is out there playing lousy baseball, sometimes above AAA-level, sometimes below, and he is perfectly free to call it quits. Clearly, he cares more about the salary than damage to his record, and, honestly, so would I (although I think the impact of those paydays may be a tad less strong for Albert than it would be for me).
The team offers the player the job. He has the option to take it or refuse. If he takes it (and while most players in history have needed a job, the elite level we’re speaking of here generally had a bit more leeway — higher salaries for years and a reputation that can help the transition), no one is performing his job but him, and I can’t see anything cruel about assigning and counting negative WAR (or WAA). The outcome is what actually happened on the ball field. It’s a stretch to say the player’s being exploited, unless, somehow, he’s receiving a salary below the level of his total contribution (on the field and to the ticket office).
On the other hand, if you want a snapshot of the basic quality of a player — how much reward you’d get for the price of a ticket to see him when he was in full possession of his talents — WAA+, along with peak stats, can sketch that profile for you in one number better than career WAR or WAA.
I think there’s no “right” answer about how we should assess a fine player’s down seasons; they’re part of the full picture, and we want that full picture as context when we focus on its various components. The weight we choose to give the negative years is a subjective choice, based on what we choose to prioritize in evaluating players.
I would say that there’s consensus that negative WAR is the team’s fault. Negative WAA is a different story. That’s mostly a contrivance I use when looking at all-time greats. I wouldn’t use WAA+ to compare single season excellence or evaluating a team’s performance.
I don’t like negative WAR. It’s mathematically necessary don’t get me wrong but I think it’s a little unfair.l
I mean, you can’t punish him for not playing, right? Ted Williams lived into his nineties and spent much of that time in a wheelchair. We obviously don’t take away wins for that, nor do we punish for once upon a time having been eight years old and inadequate baseball players. WAR is measuring how much or little someone contributed to winning or losing. If you didn’t play, you didn’t contribute, nor did you hurt. So you get zero. It’s the same logic that says you shouldn’t punish Nettles for playing for teams desperate enough to play him in his forties. So I would say the only fair thing is to that nothing as zero.
Ferrell makes for a bit of an unusual comp here, because there’s no way he gets voted into the COG or even taken all that seriously for it without his 11.8 batting WAR. If you count that in, his WAR total is 60.6, right behind Pettitte, and his WAR/1000IP is second to Schilling and ahead of all the current ballot members at 23.1.
Sutton really stands out as a “complier” relative to the other candidates with your WAR/mIP stat, which also seems to show why ferrell made it, and Schilling made it easily while the others lingered on the ballot. Brown is probably the best pure stat candidate on the ballot, but a lot of people hate him. Reuschel is next, but a lot of people don’t really trust the park and defensive adjustments for him. I tend to think those two, and maybe Tiant ultimately belong, but that’s not my vote — have consider position players as well. 🙂
Michael, I think you’re right on all this, but I wouldn’t say anyone necessarily “hates” Brown. The problem is that Brown’s clear PED use in his later years undermines his statistical advantage. The PEDs allowed Brown to lengthen his career by overcoming injuries and pitching with an enhanced body. If you take away those years, his stats don’t look as exceptional (although his peak is still great), and his short career, relative to other candidates, becomes even shorter. Naturally, some voters simply won’t vote for someone they believe cheated in an essential way, but even those who will vote for PED-tainted candidates whose careers are outstanding, and remain so when you discount for PEDs, may have trouble with Brown.
I have a strong dislike for Bonds and Clemens — I think they were bad characters — and PEDs matter a lot to me. But I voted for both Bonds and Clemens for the CoG because they were clearly among the greatest players of their generation before PEDs kick in. (I don’t support them for the Hall, but the grounds there are different.) Their cheating does matter to me, but clearly, it’s a matter of degree. I don’t really have a view of Brown’s character at all — he wasn’t a player I ever focused on — but I don’t think he’d have much support for the CoG without the PEDs. His cheating matters too, and in his case, it’s a further setback on a borderline case: in matters of degree, the impact of the same degree can vary.
Perhaps you are right. I tend to largely ignore PED considerations here because there is no character clause, and also we seriously do not have any clue who was or wasn’t taking them beyond the few people who were caught. And I didn’t realize/remember that he was a definite user and not just suspected (perhaps new shit has come to light since I was active here during the original COG process). I’m really down on penalizing people for suspected PED use, because I think there are probably a LOT of players who used them but were never suspected and assumed clean just because they never got bulky or had other obvious markers. It would not surprise me in the slightest if at some point we end up seeing some deathbed confessions of or posthumous investigations that show PED use from players everybody thought and still thinks were 100% clean. And I am 100% certain that there are also guys that almost everybody suspects despite no hard evidence or failed tests that *were* really clean.
Anyway, if he’s admitted use or had a failed test, I get why you’d knock him enough to keep him out of the COG (I’ve done that myself with Palmeiro and Sosa who have comparable pure stat cases) even though his numbers look like he belongs.
Michael, the Mitchell Report goes into great detail on Brown and PEDs. I cited the full entry in a comment to last year’s CoG Part 2 string (near the top, in reply to the second comment, from Doom) — I don’t want to repeat it here, chiefly because I think it would irritate Brown’s supporters, but if you’re interested, it’s available. Based on the Mitchell report, I estimate up to 25% of Brown’s career WAR was PED-based.
Here’s my vote:
Main ballot: Dahlen, Tiant, Wallace
Secondary ballot: Dawson, Lyons, Reuschel
An extra word about Wallace. In past CoG rounds, I’ve often chosen only one between Dahlen and Wallace, and it has usually been Dahlen, who has a clear and outstanding profile as a premier shortstop, and whose WAR as an infielder is significantly (but not overwhelmingly) higher than Wallace. But in supplementing nsb’s table, I noticed that in his 400 innings as a pitcher, Wallace’s WAR rate was more or less competitive with others whom we’re considering for the CoG on the basis of pitching skills. It reminded me that Wallace did not leave pitching behind and become an infielder because he wasn’t a successful pitcher: he was a very good pitcher. The problem was that his team, which included Cy Young and George Cuppy, was overloaded with good pitching, and Wallace promised to provide something they needed more: a strong third baseman (and he proved to be better than strong).
I think Wallace gets short shrift because it’s hard to know what to do with his pitching record. The result is that his high quality age 21-22 seasons are basically ignored because they don’t fit in with the many seasons that follow. But if we translate his 126 ERA+ over those seasons and say that in addition to his long record as an infielder Wallace had two other seasons in which he performed at a level 26% above league average, I think the strength of his case becomes clearer.
I didn’t even know he pitched. I don’t really like either guy to be honest but I will keep that in mind when it comes up again if I’m picking between them.
Why are we only having 4 rounds of voting?
Smith and Baines were also elected.
Irony? Or did it slip your mind that the COG duplicates the regular BBWA number of electees?
I think it nicely rounds things out that we exclude the supplemental. We have fewer spots but the actual hall has a lot of stupidity. The “level” is more closely aligned when we are forced to pick with fewer spots.
Re-introducing PaWaa
Designed to measure “greatness”.
This is Plate Appearances per Win Above Average
Here are the career leaders:
PaWaa – Career – Minimum 2000 PA
84.4 … (10622) Babe Ruth
96.0 … (4673) Mike Trout*
97.2 … (9480) Rogers Hornsby
102.1 … (12606) Barry Bonds
104.0 … (9788) Ted Williams
113.5 … (12496) Willie Mays
123.1 … (9663) Lou Gehrig
125.7 … (9907) Mickey Mantle
127.7 … (11748) Honus Wagner
128.5 … (13084) Ty Cobb
135.8 … (11992) Tris Speaker
137.3 … (10062) Mike Schmidt
138.9 … (2084) Red Ruffing
140.5 … (7673) Joe DiMaggio
141.3 … (5695) Joe Jackson
147.3 … (5804) Jackie Robinson
150.7 … (13941) Hank Aaron
153.8 … (9676) Jimmie Foxx
155.8 … (12717) Stan Musial
160.4 … (12207) Alex Rod
160.7 … (11348) Melvin Ott
________
Of course, there is great variation in players’ length of career.
Someone like Pujols, who lingers without being above average, slides down the list.
So let’s look at the leaders through the first 7,000 PA of career:
PaWaa 7000
77.1 … Babe Ruth
94.0 … Rogers Hornsby
97.0 … Ted Williams
104.2 … Ty Cobb
105.6 … Mickey Mantle
106.8 … Willie Mays
107.9 … Honus Wagner
108.1 … Barry Bonds
111.2 … Albert Pujols
117.1 … Stan Musial
117.3 … Lou Gehrig
117.6 … Mike Schmidt
124.5 … Rickey Henderson
125.3 … Tris Speaker
125.4 … Alex Rod
135.2 … Joe DiMaggio
135.3 … Jimmie Foxx
135.4 … Hank Aaron
136.4 … Wade Boggs
139.6 … Joe Morgan
142.4 … Ken Griffey
143.4 … Mel Ott
145.7 … George Brett
_____
And now, for our current candidates:
PaWaa
222.3 … Dick Allen (7315)
262.0 … Willie Randolph (9461)
262.2 … Bill Dahlen (10411)
262.6 … Ken Boyer (8272)
273.8 … Manny Ramirez (9774)
276.4 … Bobby Wallace (9617)
288.2 … Todd Helton (9453)
311.8 … Graig Nettles (10228)
320.3 … Dwight Evans (10569)
339.2 … Richie Ashburn (9736)
358.8 … Bobby Abreu (10081)
368.8 … Andre Dawson (10769)
509.7 … Ted Simmons (9685)
____
PaWaa 7000
206.3 … Todd Helton
213.0 … Dick Allen
223.8 … Graig Nettles
226.0 … Ken Boyer
227.6 … Bobby Wallace
229.0 … Andre Dawson
232.4 … Bobby Abreu
240.1 … Willie Randolph
240.8 … Manny Ramirez
246.0 … Bill Dahlen
254.2 … Richie Ashburn
262.7 … Dwight Evans
297.0 … Ted Simmons
_______________________
For context, here are some of the players in the same range of PaWaa 7000 as our candidates
(I forget if this is a comprehensive list)
220.7 … Yogi Berra
227.8 … Ryne Sandberg
231.5 … Tony Gwynn
233.6 … Tim Raines
236.2 … Eddie Murray
237.4 … Minnie Minoso
240.9 … Joe Cronin
244.0 … Brooks Robinson
245.6 … Robin Yount
246.1 … Paul Molitor
248.0 … Lou Whitaker
______
I seem to have lost my file with the IpWaa leaders…
Interesting stuff, Voomo.
Especially liked the last, showing others with similar rankings as those currently on the ballot; by that measure would seem that most of our candidates are worthy of consideration.
Great work, Voomo. Also reminds you of who really is “Inner Circle”. One small question, since I noticed Red Ruffing on there, who had Did you adjust Ruth’s PaWaa for his pitching WAA?
Those are purely Ruth’s offensive numbers.
His IpWaa is 132.7
Which is good, but not great.
Here is a sample of where that stacks compared to some guys we know:
73.5 …. (1969) Dean
80.3 …. (3256) Brown
93.1 …. (3548) Reuschel
101.0 … (3486) Tiant
107.4 … (3286) Eckersley
109.3 … (3170) Ford
136.6 … (2719) Claude Passeau
141.8 … (3219) Dutch Leonard
144.8 … (2781) Lon Warneke
152.1 … (3104) Bucky Walters
Vote:
Kevin Brown
Dwight Evans
Manny Ramirez
Todd Helton
Ted Lyons
Willie Randolph
Of all the people on either ballot, I think Andre Dawson was the best player listed. I’m confused why he has long been relegated so low in favor compared to Lofton, Evans, Ashburn, and others. Dawson’s defense is getting overlooked. Old Dawson could not play center. He didn’t keep his defense in his later years like Lofton, Hunter, or Cameron but in his prime he was a gold glove center fielder and I think that’s lost. His offense was consistently above average but I think we’re discounting the overall value of the 8-time gold glove winner by selectively remembering his most recent campaigns. In the late 70s and early 80s, there were few more complete players in all of baseball.
Main Ballot: Nettles, Simmons, and a third guy I don’t really want to vote for but have to complete my ballot with in Dahlen
Secondary Ballot: Dawson, Randolph (how he’s that different from Boyer, Grich, Whitaker, Trammel, etc is beyond me), and Pettitte
Doom, I read your posts on Kevin Brown every cycle. Even the ones where you copy and paste some stuff from the previous threads. I hear you, I just can’t look at his raw numbers without some kind of correction and it doesn’t hold up.
When do I get to vote for Monte Irvin again?
It’s going to take a while before that chance to vote for Irvin comes up, mosc. According to the rules Doug proposed and we accepted last year, governing the Secondary Ballot:
– players appearing on fewer than 10% of the secondary ballots cast will drop from the secondary ballot and will only become COG-eligible again if elected in a future Redemption round
– future redemption rounds will occur when there are three or fewer players on the secondary ballot
Judging by the vote so far (only 8 ballots, if I’m counting right), no Secondary Ballot candidate has less than 37.5% of the vote, so it’s unlikely anyone will get booted this round, while there are some Primary Ballot candidates who may be in danger of swelling the Secondary Ballot ranks.
Mosc, that’s an interesting comment about Dawson. Made me reevaluate him and hold up voting. I think Dawson is too identified with the “blank contract collusion” year, 1987, and after, when he was still a great power hitter, but his knees started betray him, He had negative dWAR for all but one season from 1985 on. And his profile, which included about a 5% walk rate, is disfavored by modern metrics. But I’m going to look again.,
Dawson’s great failing was an inability to take a walk, with a top season total of only 44, and a career walk rate of only 5.5%. On an earlier thread (probably a COG post), he was compared to Evans who, of course, walked a lot, but lacked Dawson’s speed. Here are their career lines.
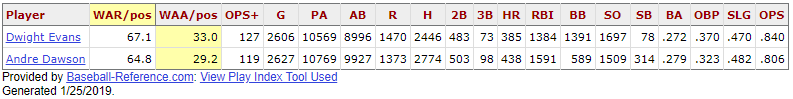
So, despite besting Evans in all the counting stats and doing so in a less hitter-friendly ballpark, Dawson still comes up a buck or two short of Evans in WAR and WAA, all because of Evans’ huge edge in walks.
From an offensive perspective, Evans had a better career than Dawson. That said, over a 8 year period (age 22-29), Dawson amassed 9.5 DWAR. That’s a long and prolific defensive career we’re washing away with the middling DH-like performances he maintained in his 30s. Dewey wasn’t bad as a right fielder helped by Boston’s cavernous side (I have long held that Fenway skews attempts between left and right field compared to all other parks and it messes with defensive stats) and managed 7.5 DWAR in right over the same age window (22-29) but at his peak was not Andre Dawson and I don’t think anybody who watched baseball at that time thought so either. Look at the MVP votes during that time.
If you go back to the 1981 all-star game (The only time they were there together. It’s not exactly fair because Evans was 3 years older but he did peak a little later) and compare them, nobody would pick Evans. It’s a shame neither played much that Summer, they both might have racked up a more sizable peak. Friggin’ greedy owners. I like peak. I agree if you look at counting value, Dawson was less valuable but he had a better peak.
Best Season:
Dawson 1982 7.9 WAR
Evans 1981 6.7 WAR
Best 3-year total:
Dawson ’81-’83 22.2 WAR
Evans ’80-’82: 16.1 WAR
Best 5-year total:
Dawson ’79-’83 32.6 WAR
Evans ’81-’85 23.9 WAR
Seasons above…
7 WAR: Dawson 2 vs Evans 0
6 WAR Dawson 4 vs Evans 2
5 WAR Dawson 4 vs Evans 4
4 WAR Dawson 7 vs Evans 8
Clearly Dawson had a better peak. Now, to be fair to Evans, that’s mostly because his offensive peak and defensive peak did not line up. Evans much like Dawson was a positive contributor in his 20s with the glove and a liability in his 30s. Unlike Dawson, his best years came later. Dewey’s bat never eclipsed 13 RBAT until age 29 when he would then average 30 through age 37! Dawson never reached 30 RBAT in a season but his best years with the stick are more typical ages of 25-35 that lined up more regularly with his defensive peak (again for both guys which is 22-29). If we take young Dewey’s right field and pair it with old dewey’s bat, I think he’d be a better candidate. Evans reminds me of Lou Whitaker with his almost entirely separate glove vs bat excellence career arcs. My peak-centric approach is particularly harsh on this type of player.
I’d ask the following research question on Dawson: “Who are the worst position players in the history of baseball to put up a 4-year WAR total of 29.0?” I bet the answer is Andre Dawson along with a half dozen other HOF inner-circle members.
As a long suffering Expos fan, despite Dawson’s admirable traits that you’ve highlighted, it was still tedious watching him get himself out by chasing bad pitches as much as he did; that 5.5% walk rate doesn’t lie!
Doug,
The Hawk won’t walk….Bill James, sometime around 1985 in one of his annual abstracts, compared Dawson and Dale Murphy by merely utilizing their road stats. Trying to emphasize the advantage that Fulton County stadium provided Murphy, by this metric it was pretty clear that Dawson was superior. IIRC, I believe even Jose Cruz’ road stats were superior to Murphy’s ?
Ok, CC. I just turned off the TV and I’m swearing off challenging you on anything you say here.
CC: Congratulations. And it’s ironic that the Final Jeopardy answer was the name of a baseball team.
Aaackkk, I missed Cursed. Fail!
Oh, that sucks, dude.
Too bad there isnt some magic machine that just lets you watch whatever you want whenever you want.
Oh, wait…
https://www.youtube.com/watch?v=gObyJTRpCzw
Nice, Voomo. I had no idea these things went up so instantly.
I advise all HHSers to check out the link and find out what we’re up against here.
Wow. I hadnt watched Jeopardy in a long time.
That was terrific.
Doomed….um, wait. Cursed?
oh man! Thank you for the link so much!
For the 1974 Part 1 election, I’m voting for:
-Manny Ramirez
-Don Sutton
-Luis Tiant
Other top candidates I considered highly (and/or will consider in future rounds):
-Abreu
-Evans
-Brown
-Boyer
-Ashburn
-Nettles
-Allen
-Wallace
-Dahlen
Thanks!
For the Secondary Ballot, I’m voting for:
-Andre Dawson
-Todd Helton
-Willie Randolph
Thanks!
Hey, it’s been a couple of years since I stopped by; hope you all are doing well.
I’m going to show my complete bias here and vote for favorites, even though some others may be more qualified.
Nettles
Randolph
Pettitte
And–wow–there are some excellent players on this ballot. I’d have a hard time choosing if I weren’t so biased. Except for Nettles; he always gets my vote.
Hi Joseph –
Welcome back! The rules have changed since your last visit. We now have two ballots. The ballot for the Circle itself is the Primary Ballot. Nettles is on it, but not Randolph and Pettitte. There is a Secondary Ballot, and the candidates on it compete to be added to the Primary Ballot: that’s the race Randolph and Pettitte are in.
To cast a valid vote, what you can do is resubmit your ballot with a list of three names from each of the ballots (that is, Nettles plus two others from the Primary Ballot, and Randolph & Pettitte plus one other from the Secondary Ballot). You are also free to vote for candidates on one of the ballots but not the other, if you like.
Okay, thanks.
Primary: Nettles, Sutton, Boyer. Last two are strategic votes–that’s allowed, right? (none of the new guys, but I considered Abreu).
Funny, a co-worker and I were discussing the new admittees to the the HOF just the other day, in particular Harold Baines (WTH?) and I mentioned Nettles as someone I think has been unjustly overlooked. His response was, “I think he should be in the HOF just for his plays in the 78 World Series.” It’s funny how when we were kids and baseball meant so much to us, we have a hard time letting go of those images.
Secondary: Randolph, Pettitte, and Dawson.
Yeah, strategic voting is still allowed — you can vote for any player on a ballot for any reason (and in the redemption round, I believe any player at all). And strategic voting has been necessary at times in this format to keep players on the ballot who clearly belong. I’m not sure there’s anybody on our list currently that you can say indisputably does belong, but there’s still more than three I’d personally be ok with enshrining and vote for if they were the best three on the ballot, so I’ll be choosing between them based on strategic considerations like always.
Hi gang, it’s that time of year again…..and 4 rounds of voting! Noticed that the secondary ballot voting will likely be churning with no one dropping off – I think last year it was suggested we do a redemption round each year to ensure the secondary ballot gets refreshed with alternate candidates. Otherwise we may never lose anyone from the secondary ballot by drop-off and cripple the ability of anyone not on the ballots to have a shot at reconsideration.
Doug – are we having a redemption round at some point among this year’s efforts? Palmeiro, Reuschel, Clarke, Newhouser, and others are fun to debate…..
Oops…..Reuschel did make it onto the secondary ballot already……how about Coveleski?
Let’s see how it plays out before deciding on another redemption round. If there’s enough support for the primary ballot candidates, the secondary ballot may shrink each round. But, if not, might consider upping the redemption round threshold from 3 secondary ballot candidates to 4 or 5.
Dick Allen, Dwight Evans, Ted Simmons
Initial vote tally!
We have 11 votes for the Primary Ballot, and I thought it would be good to bring everyone up to date about where the voting stands. Only 10 have voted for the Secondary Ballot, but since all candidates are well above the 10% mark I’m including that tally too. (Asterisks are for Primary Ballot players on the bubble, who will drop from the ballot of they draw under 10% of the votes.)
Primary Ballot
With 11 ballots submitted, with these results:
=================50% (6)
4 – Dwight Evans, Luis Tiant
=================25% (4)
3 – Kevin Brown, Bill Dahlen, Graig Nettles, Manny Ramirez, Ted Simmons*, Don Sutton*
2 – Dick Allen, Ken Boyer*, Bobby Wallace,
=================10% (2)
1 – Richie Ashburn
Secondary Ballot
With 10 ballots submitted:
9 – Andre Dawson
6 –Willie Randolph
5 – Todd Helton
4 – Andy Pettitte
3 – Ted Lyons, Rick Reuschel
====================10% (2)
Voters so far: Doug, koma, Doom, Gary B., Bruce G., epm, Voomo, mosc, opal, Joseph, T-Bone (Primary only)
Don Sutton? Let’s compare him with the six other pitchers—all in the COG—who have the same approximate numbers of innings pitched:
Ph. Niekro——-97.2 pWAR, 50.8 WAA, 188 Hall of Stats Rating
No. Ryan——–84.1 pWAR, 35.4 WAA, 146 HOS
Ga. Perry——–93.4 pWAR, 45.3 WAA, 174 HOS
Wa. Spahn——92.6 pWAR, 41.1 WAA, 177 HOS
St. Carlton——-84.4 pWAR, 40.0 WAA, 168 HOS
Pe. Alexander–117.1 pWAR, 77.0 WAA, 252 HOS
Do. Sutton——-68.6 pWAR, 23.3 WAA, 113 HOS
So-o-o, yeah, he’s last in all categories—but that wouldn’t matter if he were, say, five or even ten percent down from the lowest figures of his nearest competitor, who happens to be Ryan, but—he’s 18.5 % below Ryan in WAR, 34.2% in WAA, 15.8% below in the Hall of Stats rating. And Ryan, well, true, he’s almost even with Carlton in WAR, but he’s 13% down from the Lefty in WAA, and 15.1% down at the HOS, which puts Sutton in a really, really deep hole.
This is “comparing apples to apples”—a nostrum I ordinarily abominate, but it wouldn’t be used so widely if it didn’t have an application.
Another comparison from the COG: In some ways Tom Glavine seems fairly close to Sutton, a long career pitching for mostly good teams, nobody’s choice as the best pitcher of his era, 300 Wins like Sutton but not as many innings, since times had changed by the Nineties. Glavine’s pWAR is 74.1, his WAA is 39.1, his HOS rating is 149. ERA+? Glavine 118, Sutton 108.
Yet another comparison: Jim Palmer was born in 1945, same year as Sutton. In 1300 fewer innings pitched, Palmer produced 68.0 pWAR to Sutton’s 68.6, 32.6 WAA to his 23.3, a HOS rating of 128 to his 113, and an ERA+ of 125 to his 108.
I just can’t see how Sutton continues to thrive in the ballots here.
It’s always interesting to see how differently those who comment on HHS assess players. I’d love to see someone actually make the CoG case for Sutton. . . .
If you except 1981, only two-thirds of a season, from 1966-86 Sutton had 20 straight seasons of 200+ IP; only one early season was seriously below average and one was very fine (maybe two). In the business world, a guy like that is simply invaluable. And baseball’s a business. . . .
Really, I admired Sutton. He seemed like an honest working stiff: at best, the second starter on a top team, but on lesser teams he could be the big dog and he just kept plugging away. His game stayed pretty constant forever, and in the mid-’80s I had to shake my head in wonder that he was still around and had somehow achieved a level of eminence that his talents would not have hinted he could achieve. I thought he was a poor Hall pick, but what could they do, faced with all those wins — in the Top Ten post-1900? The CoG isn’t the Hall, and I don’t see the CoG case . . . I suppose the folks at Fangraphs do: by ignoring the greater part of Sutton’s games, they are able to find 85.5 WAR to give to him almost 30 More than Palmer, and 20 more than Glavine (but 20 less than Ryan).
I think you just made a reasonable case, honestly. I mean, I don’t think fangraphs is correct that FIP is the be all and end all, but the fact that his FIP results are better than his RA results, suggests that the results (and bWAR) may be underestimating his value as a pitcher, even if I don’t really trust fangraph’s number.
I’m not voting for Sutton, he not in my COG, and he’s probably my least favorite of the candidates on the current ballots, but..
1. Anybody who was worth roughly 70 wins over the course of their career is not going to be a travesty of a selection, no matter how weak their peak relative to other enshrinees. Yeah, Sutton is the classic compiler, but unlike raw counting stats, you can’t compile any significant amount of WAR unless you’re adding value to your teams.
2. You’re not comparing him here to any pitcher that had trouble getting selected to the COG. Everybody you’re talking about sailed in with no real question including Glavine and Palmer. Those that hung around for a bit, it was only because there were lots of obvious selections on the ballot when they came on. We’ve also elected pitchers (with fewer IP of course) that had to be debated for years and really were borderline. Pitchers with lower HOS rating, though not sure about WAA. None of these were, so *of course* a borderline guy is going to be well under them in a lot of ways.
So I looked the list of pitchers with under 30 WAA and at least 50 WAR post integration or 65 WAR if they mostly played pre-integration. Just to see who we’ve got and what we’ve done with them. I didn’t include anybody who’s never showed up on a COG ballot because they are too young (or old).
These are the players we’ve elected who fit the bill in descending order of their WAA:
Whitey Ford 28.7 WAA, 52.5 WAR HoS 104 — Elected to COG
Hoyt Wilhelm 26.9 WAA, 50.1 WAR HoS 108 — Elected to COG, primarily used as reliever
Wes Ferrell 23.8 WAA, 49.4 pWAR 11.8 bWAR HoS 112 — elected to COG.
I’m not going to include Satchel Paige, who was not elected based on MLB stats at all. And Juan Marichal made it in with exactly 30 pWAA.
None of these sailed in, though Wilhelm had it easier than the other two. I think it’s realistic to say, given how extensive the debate wa about Ford and Ferrell, that they are on the borderline (among some others
There’s no pitcher with lower WAA than Sutton who we’ve elected, but then he has 16 more WAR than Ford. Hall rating says that’s more important than Ford’s peak, but I also know that pretty much everybody who pushed for Ford did so because they felt his RA/WAR stats didn’t pass the smell test. So I’m not sure he’s a fair comp.
Anyway, looking at those, it seems like Sutton could arguably go.
OTOH, let’s also look at who we *didn’t select in that range:
Red Faber 29.4 off 68.5 WAR
Don Drysdale 28.8 off 61.4 WAR
Chuck Finley 28.6 off 58.5 WAR
Jim Bunning 28.6 off 60.5 WAR
Ted Lyons 28.1 off 67.6 WAR
Wilbur Wood 26.2 off 52.4
Billy Pierce 26.0 off 53.2
Orel Hershisher 24.9 off 51.6
Jerry Koosman 24.3 off 57.2
Mark Langston 23.5 off 50.2 WAR
Don Sutton 23.3 first ballot 68.6 WAR
David Wells 22.2 off 53.8 WAR
Tommy John 22.1 off 62.5 WAR.
Larry Jackson 21.3 off 52.7 WAR
Frank Tanana 20.0 off 57.6 WAR
Kenny Rogers 19.6 off 50.7 WAR
Early Wynn 17.0 off 52.0 WAR
Jamie Moyer 12.7 off 50.0 WAR
I also noted three very strong pitchers of the 70s-90s who just missed 50 WAR and had higher WAA than Sutton:
Ron Guidry, Jimmy Key, Dwight Gooden.
I’m not saying I take many of these guys over Sutton, but at least 4-5 are probably better candidates.
Drysdale, Bunning, Lyons and John all got some spirited discussion here, though ultimately none of them stuck on the ballot, and I’m ok with that decision in every case. John had fewer WAA *and* fewer WAR than Sutton, but does get some historical significance points and probably wouldn’t have had much play without those. I was less active by the time Red Faber would have got on the ballot — can’t remember if anyone was stanning for him or not.
I think we can also imagine — if any of Wilbur Wood, David Wells, Jimmy Key, Chuck Finley, Ron Guidry or Dwight Gooden had been able to stick around as an average to just below average pitcher for another 5-8 years and hit 65 WAR and about the same WAA/peak, would they be good COG candidates? I’d say borderline at best, so that’s sutton, borderline at best.
And frankly, I’d take most of those guys in that alternate universe ahead of sutton, so I have to agree that Sutton is not a great candidate.
But the point of all these guys still being holdovers is that you can do an analysis like this that shows *any* of them to be probably unworthy, or you can cherry pick a little and make them look worthy.
There are very few players with >68 WAR who’ve not been elected. In fact, when I looked, not a *single* eligible pitcher with more WAR than Sutton (except 19th C only pitchers) has failed to achieve election to the COG. (There are three close behind with more WAA that are waiting, Red Faber is off the ballots and Brown and Reuschel).
Anyway, though I’m not planning to vote for Sutton, I don’t think he’d be the worst selection we’ve made, and a *VASTLY* better than some of the weaker BBWAA selections. He’s arguably got about as good a case as the three I mentioned above and a couple others.
Before leaving this subject I would like for everyone to recall a couple of things:
1) The title of the hypothetical group of superior players the voting enshrines is called the Circle of Greats. I urge you to consider the listings of those players, only a couple of clicks away from this page. When I personally look at those listings, I see an element of “Greatness” in nearly every player, either from their statistics alone or from some facet or several facets of their playing or pitching performance. Ford, who gets heavy bombardment here, was arguably a great pitcher for several reasons, regardless of his relatively low WAR reading. No need to rehash that now. Killebrew—my own choice for the least worthy player in the COG—nevertheless was a truly great home run hitter.
Is Sutton’s longevity a sign of greatness? Is there more?
2) The stated aim of the Circle of Greats is not to separate the wheat from the chaff, but to isolate the the best wheat from the not quite best. There’s disagreement, of course, about what that entails, and the voting has been at something of an impasse of late because there are so many uninducted players whose records lie on the borderline between the two nearly overlapping categories, and none who are obviously among the best except those rare few who appear each year when they reach the base age of 45.
This round of voting will decide that one of those borderline players makes the grade.
Well, whatever you do, you have to draw the line somewhere. Somebody is going to be the last guy in, that some people feel belongs and some people don’t. And realistically, it’s going to be a bunch of guys just in or just out, that we could have endless arguments about.
IMO, Ford is basically what the BBWAA *thought* Jack Morris was — a guy who’s traditional stats look spectacular and who had very good press in his day Unlike Morris, he still looks HoF quality after going through the sabermetric ringer and accounting for all the great teams he pitched for and solid defenses he pitched in front of. Killebrew wasn’t on my list either, but I’m not particularly sad about either of these guys going in — they clearly have an element of greatness.
But I’d say that’s true of everybody we’re debating! Including Sutton. The difference between all these guys and the obvious selections is that it’s not *clear*. They all have an element of greatness, but they also have some knocks that suggest they may have been less than great or did not maintain their greatness long enough to be in the top 119 (or whatever it is now) players of all time. Just gotta argue it out and elect one of them.
I’m having a hard time getting excited about this crew. Need more time.
Primary: Kevin Brown, Don Sutton, Graig Nettles
Secondary: Todd Helton, Andre Dawson, Rick Reuschel
Glad to vote again.
Brown, Manny, and a vote to a personal favorite, Bobby Abreu.
Secondary, Dawson, Lyons, and Helton.
Why is he a personal favorite? I never thought the guy got much fan connection thanks to moving around a lot and general disposition.
Main ballot vote:
Manny
Kevin Brown
Dwight Evans
Secondary Ballot vote:
Dawson
Randolph
Pettite
Since the 1901 border has become an issue for the assessment of Bill Dahlen and Bobby Wallace, I thought I’d try an experiment. Using the B-R Play Index, I sorted on WAR for players who played at least 60% of their games at shortstop in the decade 1901-10. The top 8 formed a natural cutoff point.
Shortstops of 1901-1910; 800+ games, sorted by WAR
WAR … WAA … Games … Ages ….. Player
84.6 ….. 64.5 ….. 1406 ….. 27-36 ….. Honus Wagner (CoG)
52.4 ….. 30.5 ….. 1374 ….. 27-36 ….. Bobby Wallace
37.8 ….. 22.4 ……. 990 ….. 30-38 ….. George Davis (CoG)
37.6 ….. 20.9 ….. 1246 ….. 21-29 ….. Joe Tinker
35.7 ….. 14.7 ….. 1322 ….. 25-34 ….. Freddy Parent
33.7 ….. 17.0 ….. 1202 ….. 31-40 ….. Bill Dahlen
29.7 ….. 12.4 ….. 1080 ….. 26-35 ….. Kid Elberfeld
24.8 ….. 11.8 ….. 818 ….. 20-29 ….. Terry Turner
Honus Wagner is sometimes mentioned as a GoAT candidate for players. He’s clearly in a class by himself, and an Inner Circle CoG member. George Davis was also a long-time standout, and we elected him to the CoG on the basis of his play over a period of two decades (1890-1909), over which he amassed 84.7 WAR at several positions, settling in as a shortstop in the late 1890s.
What I wanted to highlight with regard to Wallace is that he is far and away superior to everyone but Wagner, whose lifetime 130.9 WAR places him in a different league, so to speak. Wallace’s decade-long performance at the key defensive position on the diamond (alongside catchers) makes a case for his inclusion in the CoG solely on the basis of twentieth century accomplishments, and, of course, he added two years as a solid starting pitcher and four years of infield excellence prior to 1901 as well (plus a couple of useful seasons after 1910).
As for Dahlen, he is part of a solid middle group (sixth in WAR; fifth in WAA) despite the fact that he was past his prime, the oldest player among these shortstops. As a 20th century player, in spite of his age, Dahlen maintained the strong play he had demonstrated during his prime, the period 1893-1900 (excluding his initial two years, before the pitchers mound had been relocated). Here are the leading shortstops of that period, sorted by WAR.
Shortstops of 1893-1900, 600+ games
WAR ,,, Games … Player
37.2 ….. 872 ….. Hughie Jennings
32.7 ….. 963 ….. Bill Dahlen
21.1 ….. 998 ….. Herman Long
19.7 ….. 863 ….. Ed McKean
13.4 .. 1031 ….. Tommy Corcoran
9.3 ……. 813 ….. Monte Cross
8.9 ……. 967 ….. Bones Ely
4.2 ……. 669 ….. Germany Smith
For those who are unwilling to credit Dahlen’s 19th century stats because of questions about the era, his 20th century stats can serve as “proof of concept,” confirming the excellence of Dahlen’s performance by watching him in a “modern” context in his period of decline (we used this sort of method to evaluate Satchel Paige, whose MLB stats in “old age,” though sparse, confirmed the reputation he’d earned as a Negro League player.
Among players bridging the 1900 divide, Davis was clearly the best; he doesn’t show up on the 19th century list only because he came to shortstop late. But Dahlen is not far behind, and Wallace, whose overall career value was closely comparable to Dahlen’s, is the leading mortal (= non-Honus) shortstop in the first decade of the “CoG era” by far. In fact, over the decade 1901-10, the five leaders in WAR among all position players were:
WAR leaders, 1901-10, position players
Wagner 84.5 (CoG)
Nap Lajoie 75.0 (CoG)
Wallace 52.4
Sam Crawford 46.6 (CoG)
Frank Chance 41.6
As a reminder, Crawford entered the CoG with 75.1 total WAR (1899-1917). Dahlen earned 75.2 (1891-1910) and Wallace 70.2, or 76.3 if the pWAR from his seasons as a pitcher is included. (I’m not making an argument that we should lower the threshold for the latter two because we elected Crawford: I voted for Crawford and believe he was a very good choice.)
Bob:
You’re on the money re Wallace especially, according to me.
Frank Chance’s name popping up here is very interesting. He’s in the HOF, but gets demerits for his short career. His WAR/PA (x 10000) for the decade is 94.91, a terrific rate. In spite of averaging only 483 PAs a season, in other words, he generated 41.6 WAR. Injuries and managerial concerns kept him on the bench a quarter of the time in his peak years. Despite that he led the league in SBs twice, runs scored once, OBP once, and from 1903-07 he finished third, second, fourth, third, and seventh in WAR in the NL.
Not that anyone cares, but the above should read 438 PAs per year for Chance in the decade, not 483.
For the record, Dahlen was 3 years, 10 months older than Wallace.
– Dahlen was a regular from 1891 at age 21.
– Wallace was a regular as a pitcher in 1895 and 1896 (6.2 WAR at age 21-22, 8th ranked ERA+ in 12 team league), and as a position player starting in 1897 (age 23).
– Their last seasons as regulars were in 1908 for Dahlen (age 38) and 1911 for Wallace (age 37).
So, Dahlen’s top 3 oWAR and top 2 WAR seasons come from his first six years that include:
– two with the 50 foot pitching distance (1891-92), the first with the AA still drawing talent away from the NL.
– first four years of the 60’6″ distance (1893-96) when the hitters had a big edge on the pitchers (1897 was probably the first season that “balance” was fully restored in the pitcher-batter matchup).
After his first 6 seasons, Dahlen had no seasons with 6 WAR or 5 oWAR and only one 4 oWAR season. His R values look like:
– 1891-1896: 3563 PA, Rpos 36, Rfield 30, Rbat 98
– 1897-1911: 6848 PA, Rpos 109, Rfield 109, Rbat 39
Make what you will of this, but that’s my take on differences from the “modern” game during Dahlen’s career.
Doug, I don’t think the figures for Dahlen are correct. Dahlen’s top three WAR seasons come in his first 8 years (not 6): 6.1 (1892), 7.1 (1894), and 5.7 (1898), and he produced four additional 5+ WAR seasons (1903-5, 1908). I suspect you were just looking at oWAR.
It’s correct that Dahlen moved from a hitter’s profile to a fielder’s.
Right you are, Bob. I was looking at the oWAR column. I’ve corrected the comment.
Primary ballot: Tiant, Evans, Boyer
I guess I’m going with an All-Overlooked ballot, obviously somewhat swayed by being a Red Sox homer, and the chance to vote for Tiant & Evans together. If fWAR can’t tell Sutton’s and Tiant’s careers apart, I can; while the career value between the two might be debatable, one of them did get into the Hall of Fame, and I still think the fun and interesting part of voting on borderline players here is to debate the non-HOF players who are probably Hall-worthy.
Oh, and hooray for the Abreu vote (thanks, JEV); all of those great years overshadowed by Schilling and Rolen on not very good Phillies teams gave me a lot of respect for Abreu as a ballplayer.
Secondary ballot: Randolph, Lyons, Pettitte
Just a minor correction: fWAR sees an ENORMOUS difference: 30.9 WAR difference, to be clear – 85.6 for Sutton and 54.7 for Tiant. On the other hand, bWAR sees only 1/10 of that difference, with Sutton being given a 68.9-65.9 advantage.
I stand by my point about overlooked players, although I confused the numbers when writing above (probably reverting in my head to bWAR because I am so much more familiar with it).
I’m hoping Evans doesn’t win this first round not because I don’t think he’ll be inducted this year but because I’d like to have a more thorough discussion of Dawson vs Evans. If Evans DOESN’T win and Dawson gets redeemed, then it’s on for Part 2.
I want to say something about Don Sutton and the two WAR systems, and I’m worried it’s going to get lost in the weeds if I put it up higher in the Don Sutton discussion, so I’m putting it here. I hope that’s okay. This is going to be VERY math-heavy, so I’m sorry for that. But if you really want a good dissection of what the WARs are doing, I hope this can help you.
Don Sutton is a fascinating Hall of Fame case. He won 324 games, losing only 256 in a very long career. That .559 winning percentage is the same (actually a little higher) than, for example, Don Drysdale’s… and in a career 50% longer! Sutton once placed five consecutive seasons in the top-5 in Cy Young voting, and pitched effectively for a decade after the last of those five seasons. He was in the top nine in WHIP every season but one in a 13-year period. He’s the same age as Jim Palmer, as pointed out above. If you pull out Palmer’s 268-152 record, you’re left with Sutton being 56-104 in his remaining starts. That means Sutton was, by this one, very narrow way of looking at things, Jim Palmer, plus like 10 years of replacement performance.
Another way of looking at it might be the series I did over the summer, in which I showed how you can (in the first part of this post) take just a pitcher’s ERA+ and Innings Pitched and see how closely his actual W-L record matches the one his statistics might cause you to figure. In Sutton’s case, he had a 108 ERA+. Square it, then divide by it plus 100 squared, and you get a .538 winning percentage (a little lower than Sutton’s actual). Divide his innings pitched by 9 and you get 587, a little higher than his actual 580 decisions. Multiply winning percentage by decisions, and you get a record of 316-271. That’s fifteen more losses and eight fewer wins than he actually recorded… but it’s in the ballpark. So he’s not someone who took advantage of crazy-favorable circumstances or something, a la Catfish Hunter.
So, if Sutton was a good pitcher, and if Sutton’s statistical record is not grossly misleading, why do the two WAR systems vary SO radically on Sutton’s WAR?
Alright, let’s dig into the weeds. As most people on this site do, let’s begin with this assumption: fWAR is trash. OK, I’m one of the fWAR defenders here, but let’s start there. Fine. “It must be FIP!” You’re thinking. FIP, of course, does not accounting for balls-in-play, and THAT’S why Fangraphs is overestimating Sutton’s value. Or perhaps you make the more nuanced argument, “Even if it’s not balls-in-play results, maybe Sutton was just bad pitching from the stretch, so his sequencing (which FIP ignores, too) is what’s dragging him down, and that’s only fair, because that’s a real part of his performance.”
Okay. That’s a fair argument. Here’s the thing, though: FIP categorically is NOT the cause of Sutton’s WAR differential. Unquestionably, it is not. Sutton’s career ERA? 3.26. Sutton’s career FIP? 3.24. They are, for all intents and purposes, identical. In fact, Sutton might be the poster-boy for consistency between ERA and FIP. From 1969-1985, the heart of his career, Sutton’s ERA and FIP were within half a run of one another every year but one, and eight times in that stretch, they were less than 0.20 off from one another. So FIP is not the cause of the difference. In fact, the “culprit,” believe it or not, is B-R‘s WAR system, not Fangraphs’. And I can prove it.
I devised a way this summer – shortly after I published some things about pitcher WAR on this site – to calculate pitcher WAR using only Innings Pitched, ERA+, and ERA (I almost had it in the fourth post that I did about pitcher WAR, but it was still in its infancy; I got it right with another few days’ work on the issue; that’s what I get for publishing before I’d worked everything out). This should produce a perfect facsimile of bWAR… or, anyway, close enough (I don’t have a reliever adjustment in it, so those guys are a different story – but that’s not relevant to this post; plus, I know some of us would LIKE seeing a reliever’s WAR without the leverage adjustment; Mariano, for example, has a career WAR of 50.7 by this calculation, even WITHOUT adjusting for leverage).
Anyway, here it is. First, you take pitcher’s ERA. Then, you multiply by (one one-hundreth of) his ERA+. This gives you the “expected ERA” for an average pitcher. In Sutton’s case, his career 3.26 ERA, multiplied by 1.08 is 3.52. HOWEVER, that tells us average, not replacement. So if you want to know what a replacement ERA is, you multiply by 20% above that. In Sutton’s case, that’s 3.52*1.2.=4.22. *Please see italicized portion at bottom of post for proof of 20% for average:replacement conversion.
We know that Sutton, then, saved 0.96 runs above replacement each nine innings, since 4.22-3.26=0.96.
We ALSO know that Sutton pitched 5282 and 1/3 innings. Divide innings by nine and multiply by the Runs Saved per nine, and you get 566 Runs Above Replacement. OK… so how many wins is that?
Well, the wins conversion is easy. Simply remind yourself of the run environment – what an average pitcher would’ve done in Sutton’s circumstances – which was a 3.52 ERA. Now double it. This is because for a “win,” you need the TOTAL runs in a game, not just ONE TEAM’S total. (This is why people often say “9 runs to a win” or “10 runs to a win” in WAR systems; there are usually 9-10 runs scored per game for most seasons in baseball history).
In Sutton’s case, that’s 7.04 runs per win. Divide the Runs Above Replacement (566) by the Run Environment (7.04), and you get 80.4. (Incidentally, if you use the B-R/Fangraphs replacement level of .297 instead of my suggested .308, you’ll get Sutton SPOT-ON at 85 WAR – which is is fWAR number, NOT his bWAR number). After some study of the issue, I feel confident in saying that the outlier is not Fangraphs; the outlier is Baseball-Reference.
So, if you’re still with me, we’re left with this question: WHY is Sutton’s bWAR so radically shifted down? And make no bones about it, he’s losing over half-a-win per year; that’s a downward shift. The thing is, I’m not sure the answer. It could be a couple of things. One, it could be that he gave up an unusual number of unearned runs. I don’t know what unearned run rates were like in Sutton’s era(s), so I can’t say; and, as you’ve probably noticed, I used ERA, rather than RA9 – so that might be the cause. It could be that B-R is making an adjustment for defense that’s hurting Sutton. It could be something in their Average to Replacement calculation, because I have Sutton at 21.7 WAA (pretty much right on board with B-R; they’re at 23.3). I’m not sure. But I’ll tell you this much: I feel confident in saying that, if one of the WAR systems is making a faulty adjustment, it’s B-R making an unfair downward adjustment, rather than Fangraphs using FIP to incorrectly adjust Sutton upward. I’m not saying that’s true in all cases; just the one of Don Sutton. If you take Don Sutton’s career statistics, I believe that Fangraphs WAR looks at him in a way that much better reflects his basic statistics, including his actual ERA, not just his FIP.
*The “proof” for 20% above replacement, by the way, is the Pythagorean theorem: if a team both scores and allows 20% more runs than average, you end up with this:
80^2/(80^2+120^2)=.3077
It’s a little higher than fWAR or bWAR’s replacement level. You can use 21.5% if you really want to be totally spot-on. But I prefer the elegance of 20, rather than the rather cruder 21.5… ultimately, though, that’s just personal preference, not something mathematically necessary. If you really want to use this tool, feel free to make whatever adjustment to replacement level you want to.
Doom,
I’m sold on Sutton. Just goes to show there had to be some reason for a 20+ year major league career
SUTTON
ALLEN
SIMMONS
DAWSON
RANDOLPH
LYONS
Doom, I think this is a wonderful post. I feel like an idiot for having assumed with such certainty that FIP was the root of the issue that I didn’t even bother to check for an ERA/FIP gap. You’ve done great research. When I said I’d like to see someone make the positive argument for Sutton, I didn’t expect anything this powerful.
I don’t see Unearned Runs as the source of the discrepancy. Sutton’s surplus over Earned Runs is a little over 10%, which seems to be the norm for the span of years Sutton bridged. I compared him to his 300-game-winning contemporaries: Seaver, Carlton, Ryan, and Niekro. Niekro has a lot more UER (over 15% surplus, as you might expect from a knuckleballer); Ryan is a little higher, the other two a little lower. (I didn’t total up the league averages — too much work; I did a few spot checks and things seemed in order). So we have to look elsewhere.
Where you do see some significant discrepancies is in strength of schedule and quality of defense. If you look at strength of schedule issues (specifically {RAave/9-RA/9}, indicating runs saved beyond an average pitcher for the specific opposition faced) for those five pitchers, and strength of defense (RA/9def), this is what you get (I’ve placed these guys’ total WAR between those two figures):
Sutton: 0.40 (WAR 68.6) 0.09
Niekro: 0.76 (WAR 97.2) -0.18
Ryan: 0.53 (WAR 84.1) -0.06
Carlton: 0,61(WAR 84.4) 0.00
Seaver: 1.08 (WAR 106.3) -0.01
These figures seem to align WAR pretty well with runs saved and defensive adjustment. That is, if you do a rough calculation by adding the two figures (treating positive RA/9def as a negative for pitcher credit) you get a result that correlates roughly with WAR:
Sutton: 0.31 . . . 68.6
Ryan: 0.59 . . . 84.1
Carlton: 0.61 , , , 84.4
Niekro: 0.84 . . . 97.2
Seaver: 1.09 . . . 106.3
Of course, that’s not real math — I believe those two figures are on different scales, and I haven’t plugged those two factors into the entire WAR formula — but I think it may suggest the direction to look to account for B-R’s take on Sutton and why it’s so far from FanGraphs’. I don’t remember the fWAR formula well at all, although I looked at it again recently, but my recollection is that neither of these two factors is included.
If strength of schedule and quality of fielding support are the major drivers in keeping Sutton’s WAR low, the questions would then be: (1) are these legitimate factors to consider; (2) are the figures correct? I think (1) is clearly a yes, but I have no way of assessing (2) in the allotted lifespan remaining to me.
The strength of schedule factor seems surprising. Why would these five pitches be facing such varied levels of competition? But if it’s the case that they did indeed have very different patterns in opponents faced, I think Sutton’s low WAR could be appropriate.
In my reply, I wondered why those five 300-game winners would have faced such different levels of opponents. On reflection, I suppose the way to approach strength of schedule issues is, for years when our pitchers were active and the season schedule “unbalanced,” to look at the offensive strength of the teams in their division, other than their own, compared to league average. I suppose that way you could get a good first glimpse . . .
Someone like Seaver, who spent many seasons playing for offensively puny Mets teams, would get a boost from recognition that for those years he never got to slim his ERA by playing the Mets, and more frequently had to face stronger offensive teams, even in “balanced schedule” seasons. (Frankly, I’m hazy about when baseball went through its balanced schedule period . . . maybe from 1977 through the rest of these guys’ careers?)
Thanks, Doom for picking up the challenge I laid down re Sutton. This is what HHS does best, or so say I.
bWAR looks at a pitcher’s performance in each game relative to the league’s performance against the same opponent. So, it’s not just what your numbers were for the season, but it’s also who you pitched against. I think that’s defensible because if you had pitchers A and B with the same season stat line, but pitcher A had 50% of his games against the top 5 teams, and only 20% against the bottom 5, and vice-versa for pitcher B, you would probably conclude the pitcher A performed better (even though we don’t know that pitcher B wouldn’t have performed just as well going against pitcher A’s opponents).
FWIW, Sutton’s splits look like this:
– against opponents with losing records: 172-105, 3.01 ERA
– against opponents with .500 or better records: 152-151, 3.50
– best ERA (min. 20 starts) against the Padres, Pirates, Braves and Mets
– worst ERA (min. 20 starts) against the Giants, Reds, Cubs and Phillies
I imagine those types of splits are not unusual; players will generally obtain superior results against weaker competition, and inferior results against stronger competition. But, that performance profile is probably not well suited to maximizing bWAR.
I’m not sure that the W-L records, or even the ERA, are central to this issue. As I understand it, what pWAR seems to measure in this respect is a pitcher’s RA performance against teams viewed against all other pitchers’ performance. So you might have a terrible record of 0-5 W-L; 5.75 RA against a really good team, but if a league average pitcher had a record of 3-4 W-L; 6.00 ERA against the same team then you’re performance adds positive value towards your WAA (and, naturally, WAR), even though you pitched terribly.
You expect most pitchers to do best against the four weakest teams and worst against the four best, but if you reversed it for some pitcher his value wouldn’t necessarily change — a run allowed is a run allowed and a win is a win. While it’s great you beat the Yankees, you gave it all back by losing to the Royals, and so forth. The relevant number is how much better or worse than average you were in holding down the runs of each particular team over your precise number IPs with each. When you smoosh all your RA against the competition you faced in one puddle and compare it against the RA puddle of the average pitcher against that precise combination in those precise amounts, you get the relevant component of WAR. Apparently, that’s a problem area for Sutton, if we’re expecting HoF-like superiority over average.
BTW, Doug. You are writing bWAR where I’d write pWAR. Am I wrong? I think of bWAR as being contrasted with fWAR (for both position players & pitchers) and pWAR as contrasted with oWAR/dWAR (pitchers vs. position players).
bWAR = baseball-reference WAR
fWAR = Fangraphs WAR
gWAR = Baseball Gauge WAR
WARP = Baseball Prospectus Wins Above Replacement Player
oWAR = offensive WAR (+ position adjustment), as figured at B-R
dWAR = defensive WAR (+ position), as figured at B-R
pWAR = something I’ve never seen written by anyone but you 🙂
Oh. Well, that’s embarrassing. I guess I’ll have to say goodbye to pWAR — I’m not sure now how he came to be, but he was a good buddy.
Actually, Doom and Bob, I’m the one who uses pWAR a lot, but it’s merely to differentiate the WAR pitchers accrue on the mound as opposed to their oWAR. It is, after all, the figure that normally shows up for a pitcher, not his pitching and batting WAR combined, and it is, with rare exceptions, the figure that is cited and argued about.
pWAR is a player’s value while afflicted with kidney stones.
…….exacerbated by an enlarged prostate
Skipping over the insightful comments of Voomo and Paul (who remind me how long it has been since HHS had female followers to keep us on good behavior), I’m relieved to have had an authority to rely on in my nomenclature, and I think nsb’s usage is useful. When I use ‘pWAR’ I also mean the calculation that shows up in B-R under the pitching category only; even though pitchers’ total WAR includes oWAR and dWAR. (I’m not sure I’ve always stuck to that distinction, but if not it’s likely because I’ve been unclear when citing a WAR figure for a pitcher exactly what it represents.)
This morning’s embarrassment was familiar to me. In my field there is a frequently used term that seems like a clumsy coinage: lots of people complain about its awkwardness, and I did so for years too. Then I received a message from a young scholar who wanted me to know he had tracked down the origin of the term, and it turned out I had coined it thirty years earlier. So this isn’t the first time I’ve written, “Oh. Well, that’s embarrassing.”
I agree that all the results, positive and negative, will tend to wash out in many instances. My point, perhaps not well explained, was that if you just do what everybody else does (i.e. pitch better against the weaker teams, and worse against the stronger ones), you’re probably going to have a tough time consistently accumulating bWAR. So, what type of pitcher would do well in bWAR? Leaving aside the obvious answer of the pitcher who pitches great against everybody, it seems to me that the pitcher who pitches to the level of his competition will be well rewarded by bWAR, getting a big boost from shutting down top teams, but not getting penalized by only pitching at a league average level against the lesser clubs. At a cursory level, Sutton’s splits do not suggest he was this type of pitcher.
Well said. It aligns with the old ideas of “pacing yourself” and “pitching to the score.” Why wear out your arm throwing at top speed to the St. Louis Browns if your teammates are likely to score a score of runs against their feeble pitching staff?
I saw a Tom Seaver interview where he indicated he would occassionally “allow” a base hit in the early going to bottom of the order hitters so that they kind of “got their hit for the day” and that hitter might not necessarily be bearing down as much later in the game in a critical situation with runners on base…… Must be how I got my hits in little league
Wow — that’s pinning a lot on kind of a pop-psych idea of motivation, but Seaver’s a very smart fellow, and I’m sure he wouldn’t be talking about it if he didn’t feel his idea had worked. No one ever gave me any hits . . . they may have tried to, though.
Jack Morris is a guy who had the reputation of pitching to the score, and his career splits tend to agree, with a 3.54 ERA against teams with losing records. I don’t know what sort of W-L record you might expect to go with that mostly 1980s ERA, but probably not Morris’s actual record of 158-66, a .705 clip. In contrast, his 4.28 ERA against .500+ teams was only good for a 96-120 record, a .444 percentage.
Let’s posit that Don Sutton’s case for admission to the Circle of Greats depends on whether his performance equals that of Whitey Ford in general terms, since Ford is regarded as one of the COG’s lesser lights. Ford’s innings pitched are almost exactly 60% of Suttons, giving us a rough picture of how to equate certain of the statistics. It’s also good to note that Ford pitched mostly in a medium to high run-scoring environment, while Sutton labored much of the time in a low to medium run-scoring environment. Park Factors are nearly the same for the two careers, 94.9 for Sutton, 94.5 for Ford.
Sutton’s RA9 is 3.58, Ford’s is 3.14; Sutton’s defensive adjustment is .09, Ford’s is .25, making the difference, 3.67 to 3.39.
The RA9 for average pitchers is 3.98 for Sutton, 3.82 for Ford. By this measure (including defense) Sutton was .15 better than average vs Ford’s .43. Ford, had 254 RAA, whereas Sutton, in 2000+ more innings, had 194. Sutton’s WAA was 23.3, Ford’s was 28.6 in 2000+ fewer innings. Career runs above replacement: Ford 494, 72% of Sutton’s 682.
The following are career cumulative stats, meaning that Ford’s were acquired in 60% of the IPs that it took Sutton to gain his.
Adjusted pitching runs: Sutton 182.3; Ford 327.8
Adjusted pitching wins: Sutton 20.5; Ford 35.0
WPA: Sutton 33.4; Ford 37.0
Situational wins(WPA/LI): Sutton 43.0; Ford 32.1
Clutch: Sutton -9.6; Ford 3.6
RE24: Sutton 300.4; Ford 398.2
REW: Sutton 34.3; Ford 44.2
Some other stats:
ERA: Sutton 3.58; Ford 2.75
ERA+: Sutton 108; Ford 133
WHIP: Sutton: 1.142; Ford 1.215
BAbip: Sutton .265; Ford .264
Career platoon advantage: Sutton 53%; Ford 23%
Home run %: Sutton 2.2; Ford 1.8
SO %: Sutton 16.5; Ford 15.0
BB%: Sutton 6.2; Ford: 8.3
X/H%: Sutton 28; Ford 25
Home Record: Sutton .558 W/L 2.81; Ford .686 W/L 2.58
Away Record: Sutton .531W/L 3.77; Ford .695 W/L 2.94
W/L vs .500+: Sutton 152-151 .502; Ford 94-61 .606
I realize that this looks like cherry picking, but in fact I am only omitting a slew of stats where the two aren’t far apart, and a slew more where Ford’s are better. Ford pitched lousy in Fenway, right? Unfortunately, so did Sutton, although not as bad.
The chief virtue of Sutton’s career vs Ford’s is that it lasted so long at a decent, though not earth shaking, level. So despite Dr. Doom’s mathematically dazzling argument above, I still really think that the question boils down to how much weight one wants to give to Sutton’s longevity and durability.
Lots to think about, nsb, and much more extensive than my response to Doom’s blockbuster.
In terms of the current ballot, why not make the comparison to Tiant, rather than the Perennial Comparator, Whitey Ford? (I know Ford is an example of borderline CoG, but so is Luis on the other side of threshold, so far.) Sutton’s stats cover about 52% more IP than Tiant’s, which frequently gives Sutton higher absolute numbers compiled at a lower rate, but also reflects his ability to contribute steadily over a long period. (The two overlap for 17 seasons, which makes the comparison, perhaps, a bit more reliable than in the case of Ford. Sutton was a steady performer, while Tiant was famous for wild swings of quality.)
{RA/9adj – RA/9}: Sutton 0.40; Tiant 0.68
R/9def: Sutton 0.09; Tiant 0.07
Adjusted pitching runs: Sutton 182.3; Tiant 193.7
Adjusted pitching wins: Sutton 20.5; Tiant 22.3
WPA: Sutton 33.4; Tiant 25.2
Situational wins (WPA/LI): Sutton 43.0; Tiant 23.9
Clutch: Sutton -9.6; Tiant 0.6
RE24: Sutton 300.4; Tiant 218.4
REW: Sutton 34.3; Tiant 24.7
ERA: Sutton 3.58; Tiant 3.30
ERA+: Sutton 108; Tiant 114
WHIP: Sutton: 1.142; Tiant 1.199
BAbip: Sutton .265; Tiant .264
Home run%: Sutton 2.2; Tiant 2.4
SO%: Sutton 16.5; Tiant 16.8
BB%: Sutton 6.2; Tiant 7.7
X/H%: Sutton 28; Tiant 32
Home Record: Sutton .558 W/L 2.81; Tiant .611 W/L 3.23
Away Record: Sutton .531 W/L 3.77; Tiant .532 W/L 3.38
W/L vs .500+: Sutton 152-151 .502; Tiant 111-112 .498
On a rate basis, Sutton comes out ahead in several categories (WPA/LI, WHIP, HR%, BB%, Home ERA, W/L vs. 500+), but Tiant seems comfortably superior overall. On a compilation basis, Sutton does well on WPA, RE24, REW.
I see the advantage to Tiant in quality, but Sutton’s quantity may balance that. However, one further thing to reflect on when looking at things like Home Record ERAs, WHIP, BAbip, or X/H% is this:
Park Factor: Sutton 94.9; Tiant 104.5
That very substantial discrepancy is built into some stats (e.g., ERA+), but it’s good to bear in mind that the stadium Sutton played most frequently in was Dodger Stadium (36%); for Luis it was Fenway Park (28%).
Looking at these figures for Sutton and Tiant, it seems pretty reasonable that B-R assesses their WAR levels as only 3.0 WAR apart (Sutton having the edge: longevity edging out quality). But how does FanGraphs come up with a differential of 30.9 WAR, ten times as great a disparity?
As Doom noted, Sutton’s +16.7 with fWAR was not a matter of FIP vastly superior to ERA (his FIP is lower, but only fractionally, 3.26 to 3.24). In Tiant’s case there’s a modest distinction: FIP 3.47; ERA 3.30, but that would seem pretty minor compared to a drop of 11.2 WAR, especially once Park Adjustments have been made, which would, I believe, bring Luis’s adjusted FIP down a bit below Sutton’s.
Basically, my sense is that there is simply less meat in the fWAR mix, and that the great discrepancy between Sutton and Tiant is largely a reflection of their total IP, with Sutton having 52% more. In bWAR that difference seems to be largely negated by a series of stats included the the bWAR formula, which tend to favor Tiant on rate measures, such as the 55% advantage Luis has in strength of schedule.
Main vote:
Allen
Evans
Boyer
Secondary:
Dawson
Helton
Evans
Richard, your Secondary Ballot is not valid because Evans is not a candidate. Looks like a slip, thinking back to the Primary Ballot. Could you correct it?
Did you mean Dawson, Helton and Lyons for the secondary ballot?
Yes I meant Lyon’s. How did you know?
So, a cool out of the blue thing happened today after my 2nd episode aired. Because the jumbo shrimp question I got mentioned the Jacksonville Jumbo Shrimp, the Marlins AA affiliate, they invited me to be a guest at a game this year and they’re sending me some gear. I didn’t even get to talk on the show about how much I love baseball so it’s a nice coincidence.
Of course, I still have some issues with the Marlins because of 1997, but I think for a moment or two I can let bygones be bygones.
That adds to another great round, CC. You were just as sharp and it was hard to believe that your reign could close on such a strong performance — it looked like extra innings for a second. You had a terrific two days. We’re all basking in reflected glory at HHS.
Who’s got the video link to day 2?
Here’s one, mosc.
eh, got axed already
I did find one, god bless random youtubers
Sounds cool, CC! I’m glad you had that very cool opportunity! Enjoy your winnings, your new pinball machine, and have fun at the Jacksonville Jumbo Shrimp game! If you’d like to work up a post for all of us to read here at HHS after you’ve gone to the game, we would more-than enjoy reading it!
Do you get to keep the 30k you won while “losing”? Not bad for 2 days. Seemed like she was pretty good with the buzzer (she got in for a bunch of stuff I can’t believe you didn’t know), and she was killing it for the insurance category. A bit surprised she didn’t get double indemnity too, but then she’s 31, perhaps not an old movie buff, and hardly anybody uses that term anymore (source: I’m a life insurance agent).
Since we are considering Sutton and there’s some very good work below by Michael Sullivan, NSB, and Bob, I want to talk about Sutton in the context of….Harold Baines (groans permissible here). Old guys (like me) remember when Sutton was approaching his 300 win and there was a debate going on about how you could let this “compiler” (we didn’t use that phrase then) into the rarified Hall–but how could you keep him out? Sutton had a terrific age-35 year (6.6 BWAR) and spent the next 8 seasons being a useful mid-rotation arm (a total of 18WAR) None of us think a 2.5-3 WAR per year pitcher is elite, yet he accomplished many of his eye-candy stats (he had 126 W after age 35 and over 1000K) just by hanging around and being useful. Other HOF pitchers did this as well–stayed around being useful into their 40’s, but they had higher peaks, and sustained those. Not saying he doesn’t belong there…but he doesn’t thrill either.
I think the thrill of looking at his fWAR against his bWAR should be taken with some perspective. fWAR is a much more simplistic calculation. Using league average everything for every ball in play tells a very different story and not just FIP vs ERA. BBREF also factors in team defense and the expected run output of the opposition. Sutton did not play against average competition and he did not play in front of an average defensive squad. LA is an extreme pitchers park too remember which is somewhat ignored by FIP (because all balls in play are treated the same). Truth is Sutton was just not that dominant. His 194 carer RAA ranks right up there with career luminaries like Al Leiter (209) and
Guys like David Cone (323), Bret SaberHagen (330), Mark Buehrle (277) or even bursts like Dwight Gooden (203 by age 28) and Felix Hernandez (257 by age 29) put him to shame.
If Jamie Moyer was as good ages 24-29 as he was 30-39, he’d look a whole lot like Sutton only better. Tommy John looks similar too. Bartolo Colon put up 197 RAA ages 25-40 though he’s pitched more below average seasons than Sutton did. Even Sutton’s career ark is not that unique. The guy gets eaten alive if you exclude his replacement level value.
Eddie Murray had a lot of trouble getting in and is viewed on here as a compiler mirror to Sutton by some but his peak was better and his standout offense was visibly different than his peers even if his position and replacement level old age drag him down.
One quick note about b-r’s use of a defensive adjustment: that’s not perfect, either. The reason it’s not perfect is the same that assuming pitchers had a league-average offense is a bad idea. Defenders do not play the same for every pitcher, every year. Tango has written about this a couple of times (I checked the old blog for the Verlander-Scherzer-Porcello posts; I remember reading them, but I couldn’t find them). You can chalk this disparity between pitchers on the same team up to a skill for the pitcher if you like; I would argue that the fact that the skill is not remotely repeatable proves it not to be so, but it’s one’s own prerogative to do so, if one chooses. As for me? I think maintaining a “balanced agnositicism,” in which we don’t make too many adjustments (B-R), nor too few (Fangraphs), gives us a better picture of each player.
To play devil’s advocate to your argument: if Cone or Saberhagen had added another 5-6 years of useful (average) pitching (10-12 WAR) to their resumes, or Gooden another 8-9 to get into Sutton’s WAR range — wouldn’t they be *fairly obvious* COG members? As it was, they got a lot of play and conversation, and I honestly thought we had put Cone and Saberhagen in! Damn, they should be on the ballot!
And in the alternate world where Colon has no bad seasons and end up with 65+ WAR to go with his 197 RAA or Moyer has more good years in his 20s and “looks like Sutton”, aren’t they at least borderline candidates too?
That all said, the thing that sours me on his candidacy the most is going back to check and seeing that we never enshrined Cone or Saberhagen — I should look and see how many other pitchers with 120+ hall rating are still outside the COG. Screw Sutton, get David and Bret back on a ballot! And I love Pettite too, but he’s clearly behind those two. Tiant is the only guy on either ballot I might put ahead of Saberhagen, and that’s iffy. And perhaps I should take a closer look at Ted Lyons.
Your comment as an ‘Old Guy” makes me feel ancient (as do most things these days), and it also brought to my deteriorating mind another possible comp for Don Sutton, but from out of the past—Early Wynn. I won’t detail their similarities—Sutton was better in most respects—but I will relate these facts:
Wynn’s win total reached the 290s in 1961. In 1962 there was a lot of fanfare about him making the 300 level, and you have to remember that back then very few 20th Century pitchers had passed the mark, Warren Spahn being the seventh in 1961, but the first since Lefty Grove twenty years earlier. Well, Wynn’s ’62 season started off OK, and in late May he even pitched a shutout, but then the sky fell for several games. Another shutout on the last day of June seemed promising, and another in late July after another couple of bad outings. Going into August he was three wins short of 300, and the hype was flowing. In August he started six times with one win and four losses. In September he started 5 times with again one win and four losses. The White Sox were out of the running by then, and Al Lopez kept his old warhorse on the mound seeking the big one through two complete game losses to finish the season. The next spring Wynn failed to make the team, and was out of baseball for a couple of months trying to get somebody, anybody, to take him on, but not just on trial for that one last victory. He wanted a regular contract. In late June the Tribe took the bait (possibly because they were having an abysmal season at the gate, their lowest attendance from 1945 to the present), and he immediately pitched a complete game loss. In his fourth start America’s nightmare finally ended, but with a whimper, not a bang: Five innings, four earned runs, but a W at last. After that he was used sparingly in relief, picking up a loss and a save.
Regarding Early Wynn:
When I did my analysis of what a pitcher’s record “should” be, given his ERA+ and innings pitched, Early Wynn shows up as one of the luckiest pitchers of all-time, and one of those who is most helped by his actual, rather than projected, pitching record.
First, he had 544 decisions; at one decision per nine, a normal distribution would’ve given him 507.
His winning percentage was actually .551; normally, a player with a 107 ERA+ would have a .534.
Using 507 decisions and a .534 rate, we get a 271-236 record.
That is definitely worse than Jim Kaat (283-237) or Tommy John (288-231), and they’re not in the Hall of Fame. So I don’t really imagine that a 271-236 Early Wynn is hearing much clamoring for the Hall of Fame. But then, Burleigh Grimes (270-212), Red Ruffing (273-225), and Ted Lyons (260-230) are in with similar records, so what do I know?
Another way to think about Early Wynn’s record is to tack on his “extra” decisions to another pitchers career. I credit him as being “worth” a 271-236 record, but he added a 29-8 record on top of that. You can turn a lot of people into HOF players by giving them a 29-8 record on what they have. Mussina* goes 299-161 with that extra help; Tommy John and Jim Kaat sail in with that addition. CC Sabathia would be sitting at 275-161 right now with that addition. David Wells doesn’t fall immediately off the ballot at 268-165. Dennis Martinez joins his pitching equal Jack Morris if he’s 274-201. So those extra decisions, and at such a high winning %, put him in a different group of pitchers.
*Incidentally, Mussina is a pitcher also helped tremendously by his record.
Actual: 270-153
Projected: 238-157
That’s 36 (half-) games… even more than Wynn received (31).
Andy Pettitte is the king, though:
Actual: 256-153
Projected: 213-155
That’s 45 (half-) games!
On 9-29-1943 Early Wynn started against the Indians while pitching or the Senators. The Senators won 7-4. Wynn pitched 4.2 innings but was given credit for the win.
Thank you, nsb, for that trip to the past. I remember listening to the end of Wynn’s 300th wynn in a motel room somewhere in the midwest, rooting for Jerry Walker (who pitched the last four innings) to put an end to the suspense. I really liked Wynn, and had been in a state of infantile apoplexy when the Sox discarded him. Although his 300th win was a very mediocre start, Wynn actually pitched extremely well in ’63: his OPS+ was 161 in 55.1 IP. (I was surprised at the time that Wynn didn’t retire as soon as he hit 300 — it was well publicized that his old team had brought him back just for that purpose. I suppose the reason was that he needed the coin, and the Indians figured there was gate to be gained.)
As for Wynn’s luck (whatever luck is), I’d say it turned. His first six seasons in the rotation were with the Washington Senators (plus a year and a half at war). Not much luck there. The rate of RA/9def for those seasons is -0.31. But he gets a break at the other end of his career, finishing (almost) with Fox and Aparicio behind him: from 1958-62 his RA/9def rate was +0.25. But when it comes to outperforming ERA+, I suppose the first guess would be run support — not something you’d expect in copious amounts from the Senators or ChiSox, but perhaps the Indians, the team Wynn wonn most of his games for. . . .
As far as being a compiler, Lou Whitaker’s “peak” doesn’t seem all that superior when compared to Sutton and Whitaker was good enough for this group. As far as peak, there isn’t a hitter on this board (save for multiple-PED-offender Manny on steroids) that can match Allen’s 165 OPS+ from age 22-32. If we damn Sutton for being a “compiler” (unlike our treatment of ‘Sweet Lou’) , then why don’t we praise Allen for his peak? There is no detritus in Allen’s age 33-35 demise-it was literally worthless. I would suggest he is our test of peak value as there aren’t many players with as much oWAR as Allen in as few plate appearances.
But, Doom’s explanation of fWAR for Sutton was good enough for me – even averaging the two bWAR and fWAR would get him there…..
Why did Sandy Koufax make the COG and Dick Allen not? Why ask why? They both have had hard core supporters but not quite enough support on a lot of ballots, but Koufax finally saw a ballot with just enough. Two other factors — Koufax’s career was cut short by injury, but it’s not clear exactly what happened to Allen. He’s also got more fame and ridiculous raw numbers on his side. IMO, even saber-minded fans have trouble not having their perceptions skewed just a little bit by unadjusted numbers (except when it comes to Coors field for some reason, everybody’s either super-rational or *over* compensates for those raw numbers).
Michael S
” it’s not clear exactly what happened to Allen”:
I believe he was frequently injured during his peak as well as suspended in 1969.
1966 – 20 games – shoulder separation while stealing a base
1967 – 40 games – lacerated wrist and severed ulna nerve while pushing a Ford in the rain
1969 – ~ 30 games – suspended for missing a double header while stuck in the Holland Tunnell
1970 – 40 games – torn hamstring stealing second base
1973 – 80+ games – broken tibia run over while fielding a throw at 1B
1974 – 25+ games – retired due to back and shoulder issues
Basically, a season and a half missed in his prime. It was an early exit from the sport when he was unwilling to be platooned and owners realized an over the hill Allen wasn’t worth the aggravation of a bat off the bench.
There is on b-ref the “play index”. Allen is one of 20 players whose oWAR, between the ages of 22-32, is greater than 0.0105 x PA. Of these 20 players, 16 are Hall of Famers. The other 4 are Trout, Allen, A-Rod, and Shoeless Joe Jackson. If he hadn’t missed the time above, he may have hit another 45-50 home runs and 250-275 hits taking him over 400 HRs and 2,100 hits….during an era of a large strike zone and limited/reduced scoring
Dick Allen had an OPS+ at least 145 in all 11 of his 2nd through 12th seasons. Ted Williams is the only other player who has done that. One of Allen’s seasons was non-qualifying and Williams had 2 such seasons.
Paul, I think you’ve restated the case we all face when evaluating Allen very well — it echoes the Allen vs. Nettles discussion above. I think everyone praises Allen for his peak. The question is how much peak for how long do you need to overcome a short duration of career contributions.
On averaging pitcher bWAR and fWAR 50/50, I get the intuitive angle, but I don’t think it stands up. There are, admittedly, problems in bWAR’s component measures — fielding, strength of schedule, and so forth. Doom focused on the simplistic measure of RA9def above — not all a team’s pitchers benefit equally from the team’s defense. Fair enough. That argues for a margin of error in those components. I can see the statistical logic in averaging those component results with similar results arrived at by different methods in other WAR formats: you’re basically averaging margins of error.
But fWAR for pitchers isn’t like that. The components are absent and FIP and IP take on extraordinary weight. What sort of margin of error does that introduce? It seems to me huge, because fWAR simply allows the many bWAR components to vary without impact. Stripping out components is not the same enterprise as averaging discrepancies among the components.
I don’t know much about WARP and gWAR — I read about each a year or two ago and nothing stuck (nothing sticks anymore these days) — but if their pitcher value calculations resemble bWAR and are defensible, I can see averaging bWAR with them, 50/50 or 33/33/33, because the exercises are comparable. But what proportion would be justified in a calculation that combines a formula based on many components and a formula that just throws out components because they involve margins of error, I have no idea. I just see the FanGraphs stat as so deeply unnuanced that it’s simply unhelpful.
Oh, to answer about Whitaker. Whitaker’s peak may not stand out, but that’s mostly because his typical season was so good!
Whitaker played 19 seasons and had only *4* with less than 3WAR or 1.5 WAA! 3 of them were his initial cup of coffee and his last two before retiring. Both of those were still above average, and the penultimate season his WAR/PA was still equivalent to a 4 WAR full season. From his first full rookie year to his second to last season, excepting only one weird 1980 season, where he must have been playing hurt or messing with his swing, putting Whitaker on the field meant getting 3-5 wins for the year. That means he was playing at all-star level for essentially his whole career. And he still had time to have two seasons *years apart* of >6 WAR.
comparing the top 10 WAR seasons for each is instructive (note — this was the kind of comparison that made Whitaker obvious to most of us, when stacked against much clearer candidates than Sutton who actually had similar or better peaks than Whitaker).
Whitaker 6.8, 6.7, 5.4, 5.3, 4.7, 4.5, 4.5, 4.4, 4.3, 4.1
Sutton 6.6, 6.3, 5.4, 4.6, 4.5, 3.5, 3.5, 3.5, 3.2, 3.2
Whitaker’s was better in every single slot but the third where they are tied.
If you add up those numbers for each you get 50.7 for Lou and 44.3 for Don. That’s a significantly better peak looking at top years in any order.
Note also that Sutton has only 11 seasons of 3 WAR out of 23, while Whitaker has 16 out of 19! And 15 out of 16 for seasons with >375 PA.
Whitaker played effectively his whole career at All-Star candidate level or better. Sutton played roughly half of his at that level.
Looking at 7 year stretches, Sutton’s best is 30.2 WAR. But he’s got a pretty well aligned peak. While there are a couple great years outside of it, there are some pretty average years in between. His second best 7 year stretch is 27.2 WAR.
Now, look at Whitaker. Whitaker’s best stretch is 32.8 WAR. That doesn’t seem like a huge difference, but her’s the kicker: Pick any 7 year stretch of his career (there are 13, or 12 if you don’t include the cup of coffee in 1977). There are only *3* (0r *2*) that don’t beat Sutton’s *best* stretch. And the 2 of those three that don’t include his 11 game 37 PA callup in 1977 beat Sutton’s second best. For age 32-38, Whitaker produced 28.7 WAR, less than 4 off his peak 32.8 from age 23-29. Sutton, *who is known for his late career production* got 21.9 WAR over the same career span of 32-38.
All this can be summed up quickly with one number, which I’m sure people were looking at when they judged Whitaker’s career value.
Whitaker 42.8 WAA 43.1 WAA+ (negative seasons removed
Sutton 23.3 WAA 27.9 WAA+
Even after removing his below average seasons, Whitaker produced ~15 extra wins above average over his career than Sutton.
That’s pretty huge difference. Sutton has a low peak because he has a low peak — but the difference between his peak and the rest of his production is pretty significant.
Whitaker has a “low peak” because his peak is basically his whole freaking career. There’s no other long-career player in baseball history whose *worst* 7 year stretches are as close to his best as Lou freaking Whitaker.
But in comparison to most borderline hall of famers or even COGers, his peak is not actually all that far below most of them. It’s just that the *rest* of his career is so much better than borderline candidates that it doesn’t stand out as much as other moderate to low-peak players.
Let’s hope this can put to bed any of this “How is Sutton (or whoTFever)” any different from that *compiler* Lou Whitaker nonsense. The only reason Lou Whitaker wasn’t a first ballot hall of famer is because the thing he compiled was *value* and non-sabermetricians didn’t understand just how much, plain and simple, and he did it beautifully and more consistently than any other player ever.
Michael
Very enlightening. Is fWAR as kind to Lou as it is to Sutton? It’s the tale of two Suttons…..
Whitaker: bWAR 75.1; fWAR 68.1
For position players, fWAR and bWAR don’t have the structural divergence in method that is the case for pitcher WAR.
Michael ,
FWIW, per fangraphs
Top 11 Seasons
6.1 6.0 5.1 4.8 4.7 4.5 4.4 3.8 3.8 3.5 3.5 Louie W. (50.2 fWAR)
7.1 6.8 6.0 5.4 4.7 4.6 4.3 4.0 3.9 3.9 3.7 Donny S. (54.4 fWAR)
Peak 5 Consecutive
4.8 6.0 3.8 4.7 4.5 (Lou 23.8)
7.1 6.8 6.0 4.3 5.4 (Donnie 29.7)
If you trust fangraphs WAR for pitchers (I don’t), then Don Sutton is a ridiculously obvious COG candidate, not borderline at all, and comparable to or clearly better than a number of pitcher’s we’ve already elected without much opposition.
If you don’t, then this comparison is basically meaningless.
Hey, I understand. Believe it or not, I still have a problem with Coors Field despite all the back and forth on that.
By the same token, Sutton did play ~23 years in the majors and there aren’t too many others that did. If he’s the weakest of the 23 year veterans or guys that threw 5,000 innings, so be it
Sutton does have the third most games started of all time. That right there is pretty impressive.
And nobody in the current generation is going to come anywhere near that.
Unless Ryne Stanek starts half of the Rays’ games… for the next 10 years.
Since this is the first CoG round of the year, it may be good to point out that the deadline Doug has posted for voting is the final minute of January, as measured in Punxsutawney PA, which falls on Thursday night. There are several contributors who have been active on this string but have not yet voted, so I thought a reminder might be helpful.
Tough choices – time to vote
Primary: Ramirez, Brown, Wallace
Secondary: Reuschel, Dawson, Petitte
I suppose, before something turns into a Pumpkin, it’s time for me to vote’
I’m only doing the Primary round, If memory serves I didn’t vote in the “Redemption” Rounds in the past, and I think I ought to stick to past practice.
Manny and Brown are out for me for PEDS, and the relatively unexciting remainder leaves me with (in no order);
Luis Tiant, Bobby Wallace, and Dick Allen.
Ok here’s my vote:
Primary Ballot:
Evans, Tiant, Nettles.
Allen and Nettles are pretty close for me, but Nettles needs the extra round more.
Back in the day, I was usually all about the strategic voting to keep guys on the ballot who I thought might belong but didn’t have much support on crowded ballots. But I’m more comfortable letting the lower half of these drop off now. There’s nobody here that I’d be upset if they got in, and nobody I’d be super upset to see left out, but these three and Allen I think belong, and maybe Brown — I have to think about how I feel around PEDs again, but he’s close enough to the border that I agree that could tip him out.
Secondary Ballot:
Reuschel, Lyons, Randolph.
Reuschel is first of all candidates on both ballots for me. I believe his advanced numbers, and IMO if you do, he very clearly belongs. I’m not really sure about Lyons and Randolph, but they are my next choices, and seem at least as good as half the guys on the first ballot.
Rule suggestion:
In order to populate the second ballot more reliably, in addition to holding occasional redemption rounds, I propose we allow write-in candidates on the second ballot. If somebody can whip up enough support for somebody to get to 10% or whatever, they can stay on the second ballot, and move forward from there. And if they actually *win* the second ballot, why not put them on the main ballot. This way, we have more opportunity to get guys who dropped out during crowded ballots back into consideration. Also, we’re in danger of having ballots where people don’t have three people they are willing to positively vote for.
I’m all for strategic voting in the sense of not always voting your top three candidates on a given ballot, but I’ve yet to make a vote where I didn’t believe that all three of my choices were worthy of induction, and I’d rather not have to.
I can well imagine people having issues with the second ballot soon if not already, but I doubt anyone can’t come up with three players they wholeheartedly support from the entire field of non-COG members. I know I can think of at least 4 players not on either ballot that I prefer to most of the players on them and would definitely support.
I actually agree with this 100%. I think we could, honestly, eliminate the Redemption Rounds altogether, allow write-ins on the Secondary Ballot, and ensure that the Secondary Ballot always has a minimum of 9 (or something) names on it. I’d never thought about it before last week, but that was the way I thought about it.
The disadvantage, of course, is that it’s possible that support would be so diffuse that someone with virtually no support or hope ends up with, say, three votes on the secondary, only to graduate to the “real” ballot, where he receives the same 3 votes, and falls off immediately. That would be the danger. I’m fine if we leave it as-is, but I’m not particularly thrilled with the guys on the secondary ballot, either, and I’m wondering if there are others out there I’d rather cast my vote for.
There is a possible variation to this–open the redemption round to write-ins but stipulate the candidate must have at least X BWAR,
I believe the redemption round is already open to write ins, which is how Satchel Paige ended up getting elected (without 10 years in MLB or 20WAr in MLB, he would never have been on a regular ballot). IIRC, it was explicitly noted that it would thus be possible to elect Negro League players and/or 19th century players who would never appear on the standard ballots.
I agree with Doom that this could potentially allow the second ballot to replace the redemption round, or essentially for the second ballot to become a permanent redemption round. Which actually makes sense now that we’re not doing a new ballot every week or two, but only right after a new BBWWAA election.
Actually, Michael, Paige moved to the Primary Ballot through a Redemption Round, and then was elected immediately. The Secondary Ballot debuted with the same election, but Paige was not on it.
Those who voted for Paige supported waiving the original birtelcom eligibility rule (20 WAR in the Majors required). However, the argument for doing so was explicitly that it would set no precedent because Paige was a unique case: the only outstanding Negro League player who was able to confirm his stature with an excellent statistical record playing in MLB, but — for reasons of age in Paige’s case — failed to accumulate 20 WAR. (The closest parallel is Monte Irvin, but Irvin did accumulate 20 WAR, and so was, and is, eligible under the bortelcom rules.) So it does not follow that other Negro League or 19th Century players are eligible for the CoG because of the exception made for Paige.
Redemption Rounds are indeed entirely write-in rounds.
I remember that there was no secondary ballot when I was voting regularly when i said he’d never have been on a regular ballot, I meant initially and that he would have had to come onto the ballot via redemption because of the 10y or 20WAR threshold. I didn’t realize that a special waiver was made for him, rather than the redemption voting generally being open to anyone outside the initial qualifications. I remember there being discussion about what to do with Paige, long before he was eligible by age around the time that (mosc?) started campaigning for a future Monte Irvin candidacy (which I also supported — his 31-37 looks a lot like a COGer or at least borderline COGer and my general philosophy has been to give all of the early black players the benefit of all doubts.
Anyway I thought it had settled out with a ruling that anyone (or maybe anyone who had played in MLB at all) was potentially eligible to be written in on a redemption round, but that was a few years ago now, so thank you for the correction.
Mike, you WAR threshold makes sense in theory, but one player who has received considerable support for the CoG in previous redemption rounds is Monte Irvin, who has good case and a passionate supporter in mosc. (Irvin received four votes out of twenty-two in last year’s redemption round.) Given that Irvin accumulated 21.3 WAR, any minimum added for a write-in process would either be almost identical with the current minimum or exclude a player who has active support.
I like Michael’s thinking, but don’t support the specific solution of allowing write-ins on the Second Ballot. The reason is that I believe the result is likely to disperse the votes on the Secondary Ballot (there are lots of write-ins whom a few people might support — just look at the list on the last redemption round), with the ballot winner often receiving very few votes — an outcome that seems much more likely to reflect a process of thoughtful comparison.
Instead, I’d be in favor of mandating that we have a redemption round every year, adding three players to the Secondary Ballot. If candidates with little actual support reach the Secondary Ballot, they will immediately drop off in the course of a year’s voting rounds.
To remind everyone of where support was most recently distributed outside those on the current ballot, here’s what the results of the 2018 Redemption Round looked like:
========== Redeemed (Leading three; tie breaker for ties)===========
8 – Satchel Paige
7 – Ted Simmons
6* – Don Sutton
========Promoted to Secondary Ballot (Next seven + ties)========
6 – Mordecai Brown, Dwight Evans
5 – Ken Boyer, Andre Dawson, Ted Lyons, Willie Randolph, Rick Reuschel
=========Nominated but Unredeemed========
4 – Fred Clarke, Stan Coveleski, Don Drysdale, Dennis Eckerskley, Monte Irvin, Rafael Palmeiro, Reggie Smith
3 – Buddy Bell
2 – Jim Bunning, Larry Doby, Hal Newhouser, Kirby Puckett, Billy Williams
1 – Sal Bando, Lou Brock, Dizzy Dean, Jim Edmonds, Darrell Evans, Ron Guidry, Orel Hersheiser, Don Mattingly, Minnie Minoso, Gary Sheffield, Early Wynn
*Using a tie breaker, Sutton was promoted to the Primary Ballot.
Paige was elected in the next CoG vote (2018 Round 2) and Mordecai Brown was promoted to the Primary Ballot, from which he was immediately elected in 2018 Round 3, with Evans going to the Primary Ballot (where he may be within a few hours of election this round). This really illustrates how volatile the vote can be — two redeemed candidates moving quickly up the ladder to election within two rounds.
It is the players with 1 to 4 votes in the 2018 Redemption Round who might be among those garnering quickest support in any 2019 redemption process. If we had a write in process for the Secondary Ballot, I can easily imagine ten or more of those players drawing votes away from the five currently on the ballot (and, I think, perhaps generating comment fatigue, along with the sixteen returning players — and yet other players could draw support and comments too). So rather than risk a free-for-all, I’d rather ask Doug to hold a redemption round before we move on to 2019 Round Two.
By the way, when I referred to the “volatility of the vote” I did not mean to suggest, randomness, fickleness, or flakiness. I think when we see sudden movement in the vote it’s generally because contributors devise persuasive arguments that simply had not previously been made. (Of course, our shifting voter pool is also a factor.)
Note to any voters left out there:
Dwight Evans leads with 8 votes.
Kevin Brown and Luis Tiant each have 7.
If you feel like making a tie, like putting Evans over the top, or just like making the last day interesting, don’t forget to post your vote!
(I would’ve done a complete vote update here, but I usually only do those at 11 votes, or 21, or 31, for math reasons – some of you will know what I’m talking about; since there are only 20 votes, I just thought I’d throw out the info without the complete update.)
Also, the next round will, I believe, also be “open;” that is, without a (the?) compelling newcomer. Then 1974.3 is already decided (I would imagine), and round 4 will be open again. So figure out who you want in, people!
A worthy tangent:
I just learned that today is Jackie Robinson’s centenary: he was born January 31, 1919.
Now, there’s a Great! His accomplishments are still a story central to America’s social memory, far beyond fans of the game.
Primary:
Manny Ramirez
Ted Simmons
Ken Boyer
Secondary:
Andre Dawson
Todd Helton
Willie Randolph
Midnight has passed, it’s February (EST), and here is an unofficial tabulation of the CoG vote for 2019 Round 1:
Primary Ballot
21 ballots submitted, with these results:
=================50% (11)
8 – Dwight Evans
7 – Kevin Brown, Manny Ramirez, Luis Tiant
=================25% (6)
5 – Dick Allen, Ken Boyer*, Graig Nettles, Ted Simmons*, Don Sutton*
4 – Bobby Wallace
3 – Bill Dahlen
=================10% (3)
1 – Bobby Abreu, Richie Ashburn
Secondary Ballot
19 ballots submitted, with these results:
16 – Andre Dawson
11 –Willie Randolph
9 – Todd Helton
8 – Ted Lyons
7 – Andy Pettitte
6 – Rick Reuschel
====================10% (2)
Voters: Doug, koma, Doom, Gary B., Bruce G., epm, Voomo, mosc, opal, Joseph, T-Bone (Primary only), Andy, JEV, Chris C., Hub Kid, Paul E., Richard C., Dave H., Mike L (Primary only), Michael S., Josh D.
That’s what I have, so Evans is elected, and Abreu and Dawson swap places on the two ballots. Everyone else survives or increases their guaranteed eligibility.
Making an obvious comment: The more diffuse the ballot, the smaller the number of voters, the greater the impact each dedicated voter has. Not being dismissive of Evans, but less than 40% gets you in?
Mike, When we had more voters players were sometimes elected with under 35% of the vote. It was a close election and no real favorite emerged. I don’t recall a single comment actually arguing for Evans on this thread.
Here are charts for player stats this round.
I’ve added, for position players, fWAR. I have not done so for pitchers because of my longstanding belief that FanGraphs pitcher fWAR is not a meaningful statistic (as discussed last string — Doom pointed out that using fWAR, Sutton and Brown far outpace Tiant among pitchers on the primary ballot). For pitchers, the parenthetical figure represents Their pitching WAR (adopting nsb’s ‘pWAR’) plus oWAR and dWAR, for ‘Total bWAR’.
Other points: WAR/Yr. includes only those seasons with 10 GS or 100 IP for starters, 20G for relievers, and 50G for position players. Career length: 1.0 = K. Brown 3256.1 IP / Allen 7315 PA.
Main Ballot Candidates
Pitchers
pWAR (Tot bWAR)…Peak5..Top5…WAR/9IP…WAR/Yr..ERA+…Career length
68.5 (68.3)…..……….37.0…37.0……0.189……4.0 (17)……127……..1.0……K. Brown
66.1 (66.7)……..…….28.7…34.7……0.171……3.9 (17)……114……..1.2……Tiant
68.7 (67.4)………..….22.5…27.3……0.117……3.0 (23)……108……..1.6……Sutton
Position Players
WAR(fWAR)…Pk5……Top5……WAR/G…WAR/Yr……OPS+…Career length
58.7 (61.3)…..31.5……36.7……0.034……4.2 (14)……156………1.0………Allen
63.6 (57.6)..…31.6……32.7……0.029……4.2 (15)……111………1.3………Ashburn
62.8 (54.7)..…33.0……34.0……0.031……4.5 (14)……116………1.2………Boyer
75.2 (77.5)..…22.6……29.8……0.031……4.0 (19)……110………1.4………Dahlen
72.4 (72.7)..…30.3……32.9……0.026……4.1 (18)……115………1.7………Jeter
68.0 (65.7)…..28.7……32.2……0.025……3.4 (20)……110………1.4………Nettles
69.2 (66.3)..…28.7……29.9……0.030……4.1 (17)……154………1.3………Ramirez
50.1 (54.2)..…23.3……26.4……0.024……2.6 (19)……118………1.4………Simmons
70.2 (62.4)..…28.6……31.3……0.029……4.2 (17)……105………1.3………Wallace*
* Wallace’s total bWAR (incl. pWAR) is 76.3.
Secondary Ballot Candidates
Pitchers
pWAR (Tot bWAR)…Peak5..Top5…WAR/9IP…WAR/Yr..ERA+…Career length
67.2 (71.6)……………24.2…29.0……0.145……3.6 (19)……118……1.6……Lyons
60.9 (60.8)……………20.3…28.4……0.166……3.4 (18)……117……1.0……Pettitte
68.2 (70.1)……………31.0…32.8……0.173……4.0 (17)……114……1.4……Reuschel
Position Players
WAR(fWAR)….Pk5……Top5……WAR/G…WAR/Yr……OPS+…Career length
60.0 (59.6)……29.7……31.1……0.025……3.8 (16)……128………1.4….…….Abreu
61.4 (55.0)……37.4……37.4……0.027……3.8 (16)……133………1.3………..Helton
65.5 (62.1)……27.2……29.5……0.030……3.7 (18)……104………1.3………..Randolph
WHOOPS! I posted this on the wrong string . . . sorry. It’s for Round 2 and I’ll repost it there.